Figure 3
Download original image
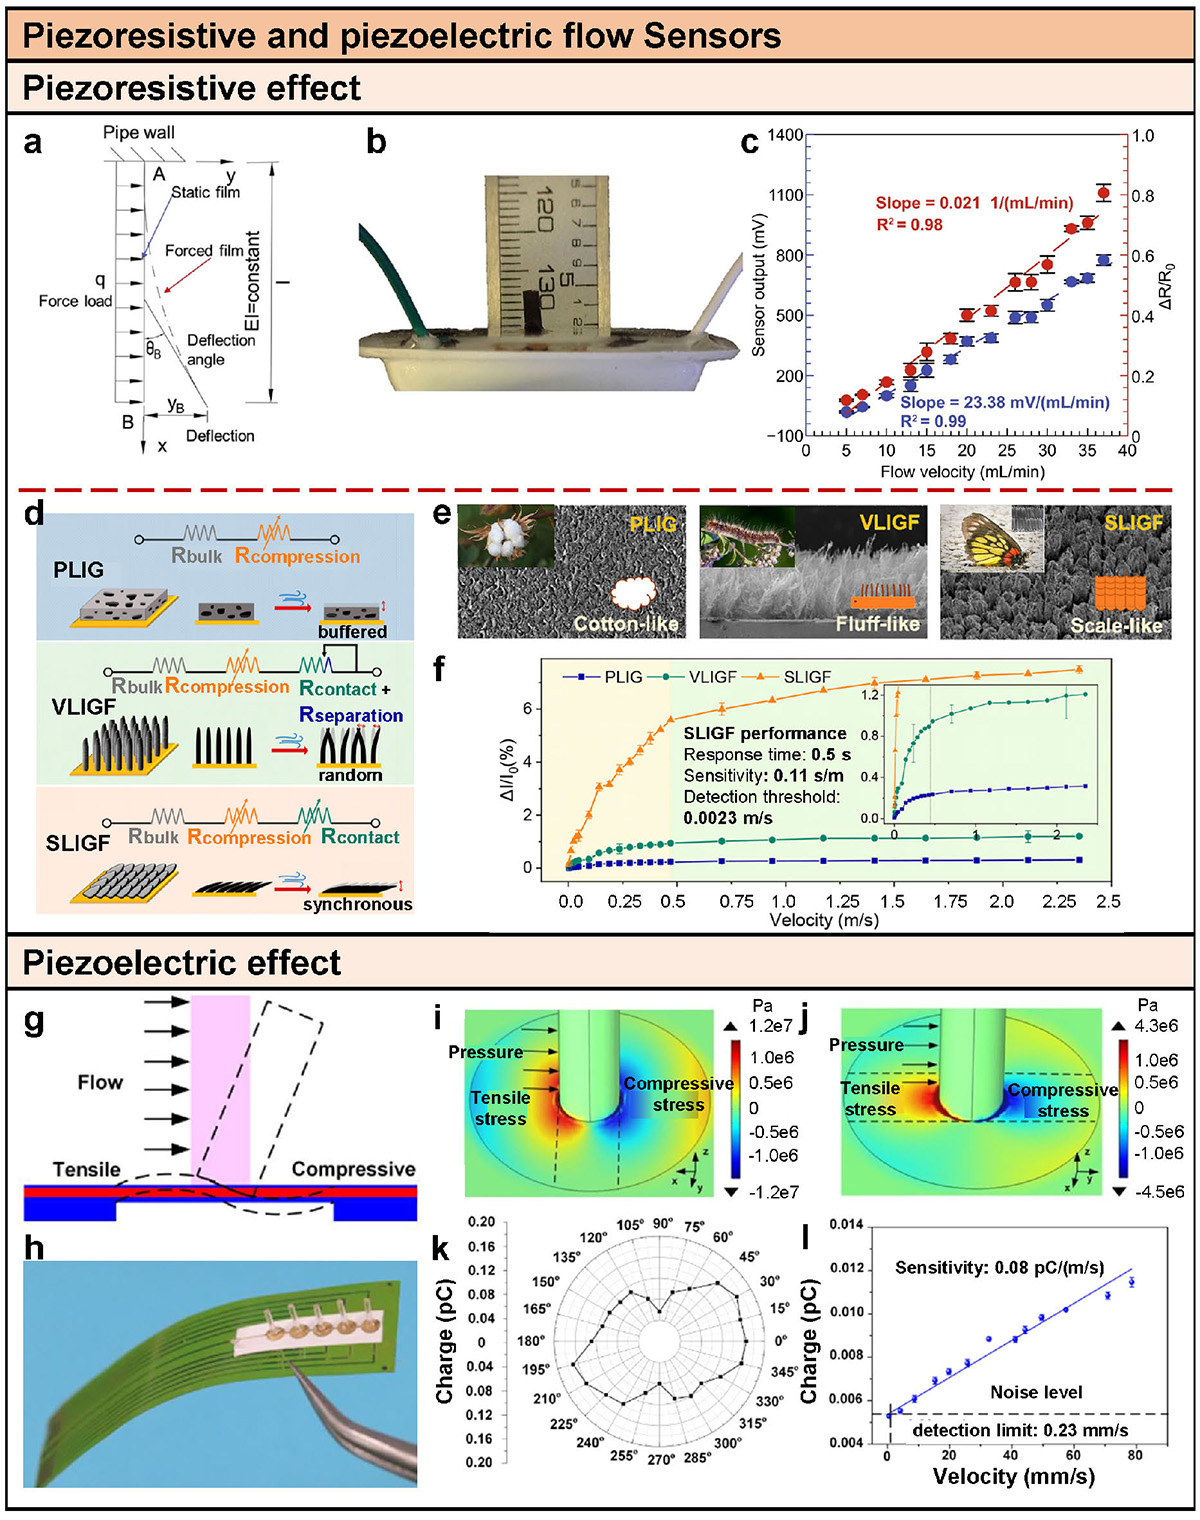
Piezoresistive and piezoelectric flow sensors. (a) Conceptual illustration of piezoresistive flow sensors [55]. (b) Schematic diagram of the flexible piezoresistive flow sensor using VGNs [57]. (c) Sensor output as a function of flow velocity (calibration plot) [57]. (d) Working mechanism of three LIG airflow sensors with equivalent circuit diagram and schematic illustration of PLIG, VLIGF, and SLIGF [59]. (e) Digital photos of cotton, caterpillar, and Lepidoptera insect-butterfly, with SEM images of PLIG, VLIGF, and SLIGF from top view. The scale bars are 250, 250 and 500 μm, respectively [59]. (f) Relative current variation within the airflow range of 0.0023–2.35 m/s [59]. (g) Conceptual illustration of piezoelectric flow sensors [60]. (h) Optical image of the hydrodynamic artificial velocity sensor [60]. Distribution of stress in the x direction when pressure is at 0° (i) and at 90° (j) [60]. (k) Results of the directivity detection [60]. (l) Relationship between charge output and velocity [60].
Current usage metrics show cumulative count of Article Views (full-text article views including HTML views, PDF and ePub downloads, according to the available data) and Abstracts Views on Vision4Press platform.
Data correspond to usage on the plateform after 2015. The current usage metrics is available 48-96 hours after online publication and is updated daily on week days.
Initial download of the metrics may take a while.