Figure 4
Download original image
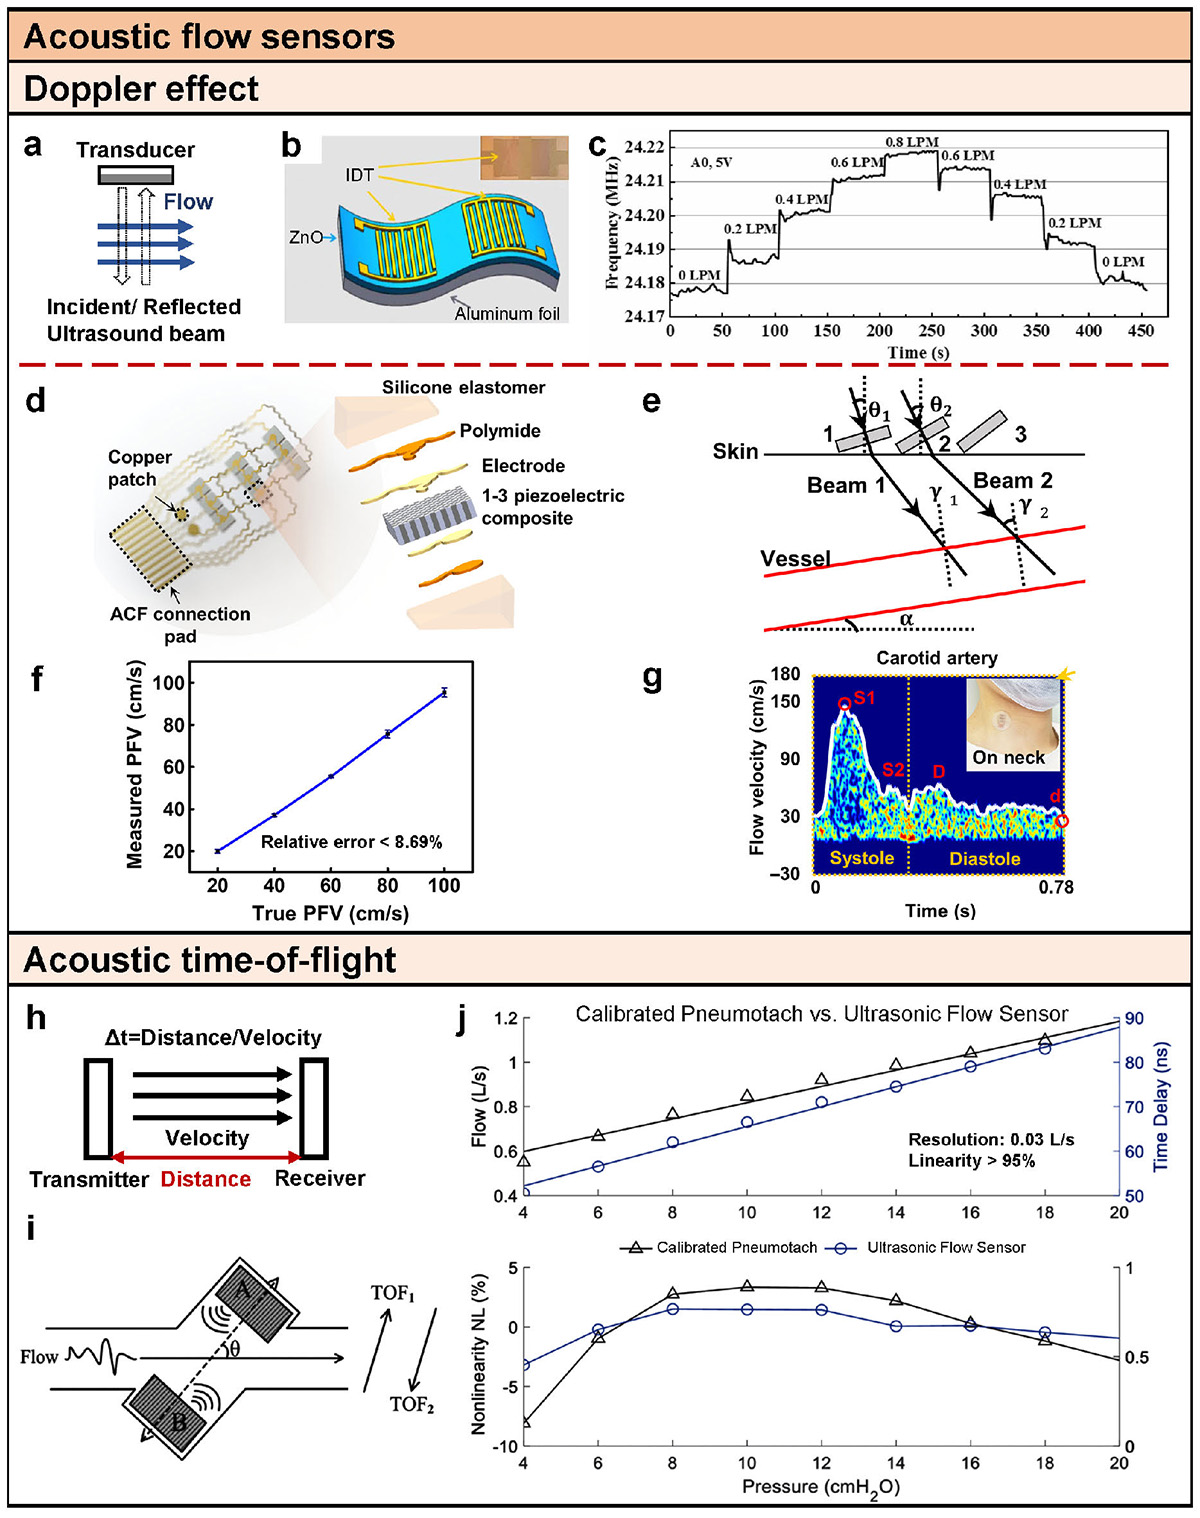
Acoustic flow sensors. (a) Conceptual illustration of Doppler flow sensors. (b) Schematic diagram and optical image (inset) of the flexible acoustic wave device [61]. (c) Frequency responses of the acoustic wave device when the flow rate increases from 0 to 0.8 LPM and then decreases from 0.8 to 0 LPM in step of 0.2 LPM [61]. (d) Schematics (left) and exploded view (right) of the device structure. ACF, anisotropic conductive film [62]. (e) Schematic of the DBUD method [62]. (f) Measured PFV versus true PFV curves. Error bars represent ±SD (N = 5) [62]. (g) Typical carotid blood flow spectra during a cardiac cycle (left) and several cycles (right). Feature points are marked in the left image. Inset: an image showing the device mounted on the neck [62]. (h) Conceptual illustration of time-of-flight flow sensors. (i) Ultrasonic air-coupling time-of-flight configuration [66]. (j) Experimental DC steps linearity test [66].
Current usage metrics show cumulative count of Article Views (full-text article views including HTML views, PDF and ePub downloads, according to the available data) and Abstracts Views on Vision4Press platform.
Data correspond to usage on the plateform after 2015. The current usage metrics is available 48-96 hours after online publication and is updated daily on week days.
Initial download of the metrics may take a while.