Figure 6
Download original image
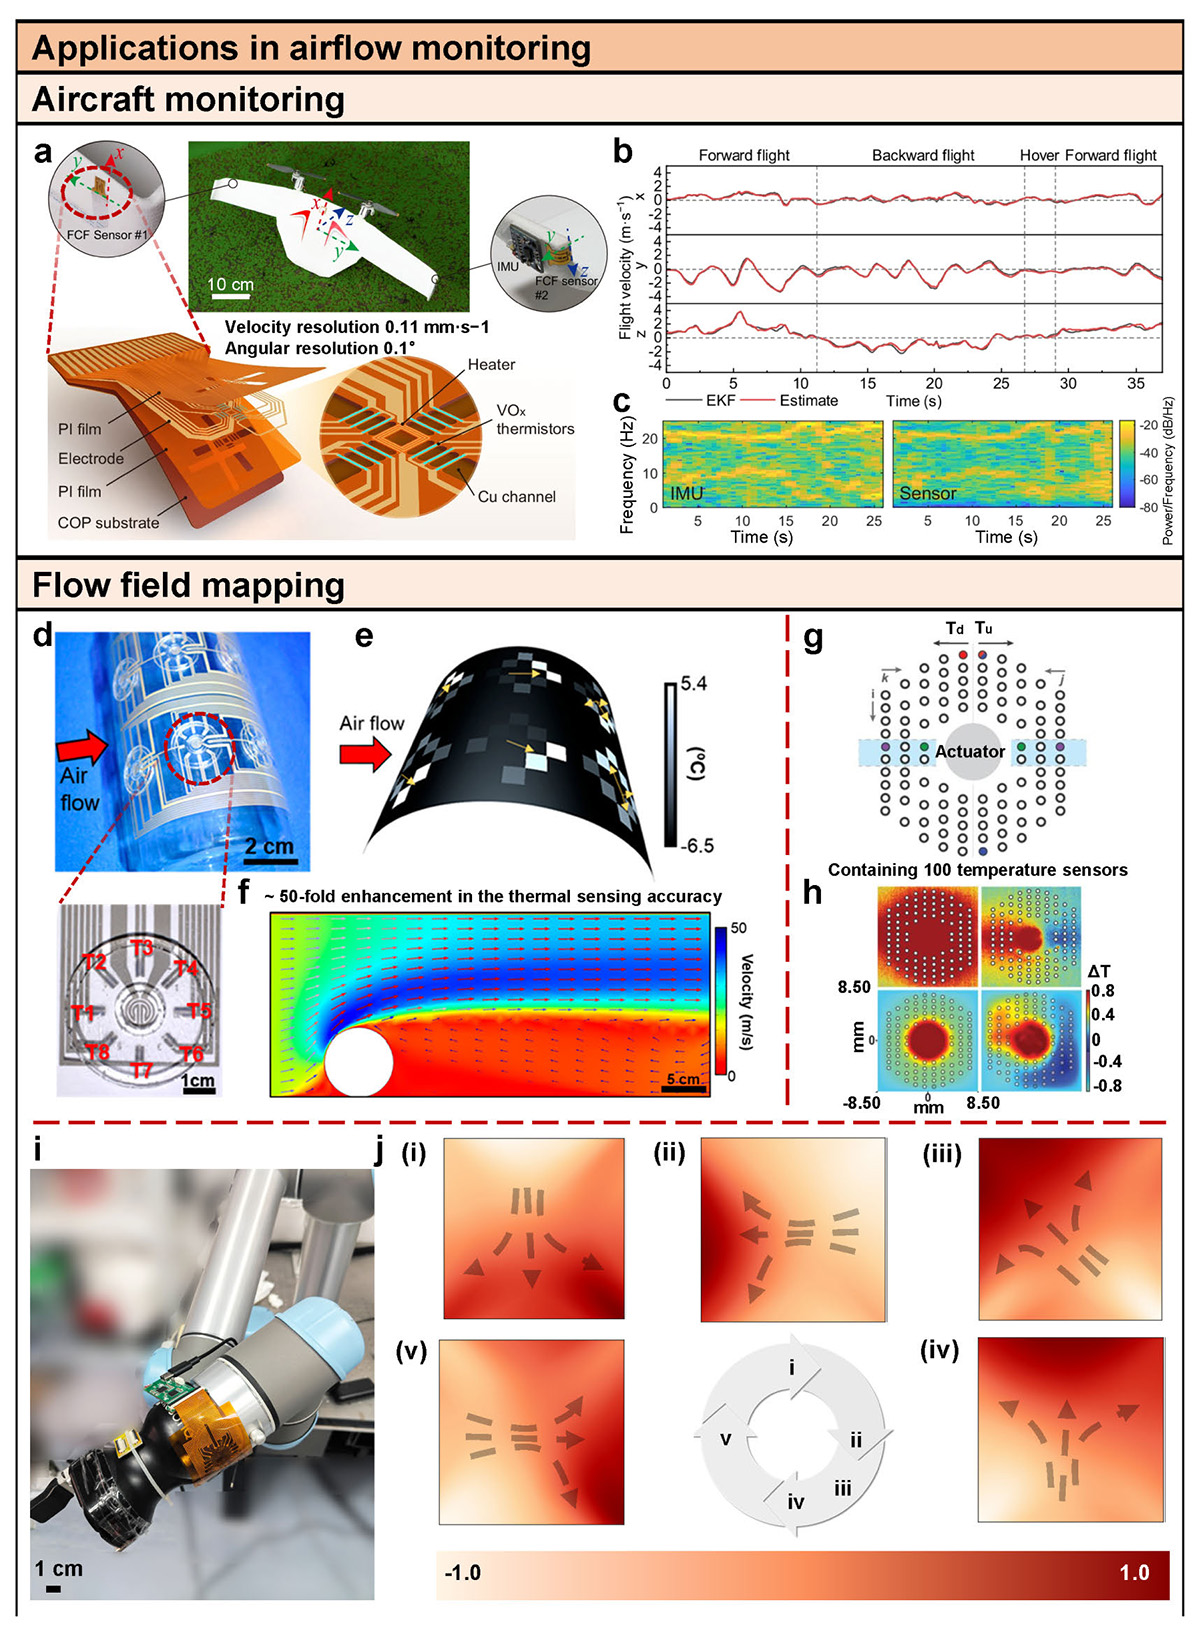
Applications in airflow monitoring: aircraft monitoring and flow field mapping. (a) MAV equipped with two FCF sensors and an external IMU module, with an exploded view of the FCF sensor [82]. (b) Comparison of the flight velocity calculated by the EKF method with the relative velocity estimated by the FCF sensor when the MAV performs forward flight, backward flight, and hovering outdoors [82]. (c) Comparison of the spectra of signals from IMU and P1 of FCF sensor #2, illustrating the wing vibration with 10 and 20 Hz as the characteristic frequencies. IMU inertial measurement unit, EKF extended Kalman filter [82]. (d) Photo of a flexible 3 × 2 thermal flow sensor array attached onto a pipe with a 7.5 cm diameter, with a photo showing the flow sensor is comprised of eight temperature sensors surrounding a heater [16]. (e) Thermal mapping image under air flow corresponding to the flow direction monitoring [16]. (f) 2D cross-sectional FEM simulation of the air flow distribution affected by a circular obstruction [16]. (g) Schematic map of a device, with indication of the tube position (blue shading), and the temperatures at upstream (Tu) and downstream (Td) locations. i, j, and k represent coordinates for sensor identification (j and k for Tu and Td, respectively) [49]. (h) Thermographs from IR imaging (top) and epidermal sensing array (ESA)-generated temperature maps (bottom) in the absence (left) and presence (right) of flow (0.02 mL/min; flow from right to left) with actuation at 1.8 mW/mm2. All data were collected on a skin phantom [49]. (i) Photo of the sensor system attached onto the robotic arm [50]. (j) Cubic convolution interpolation of the eight temperature sensors as the robotic arm runs for one cycle [50].
Current usage metrics show cumulative count of Article Views (full-text article views including HTML views, PDF and ePub downloads, according to the available data) and Abstracts Views on Vision4Press platform.
Data correspond to usage on the plateform after 2015. The current usage metrics is available 48-96 hours after online publication and is updated daily on week days.
Initial download of the metrics may take a while.