Figure 7
Download original image
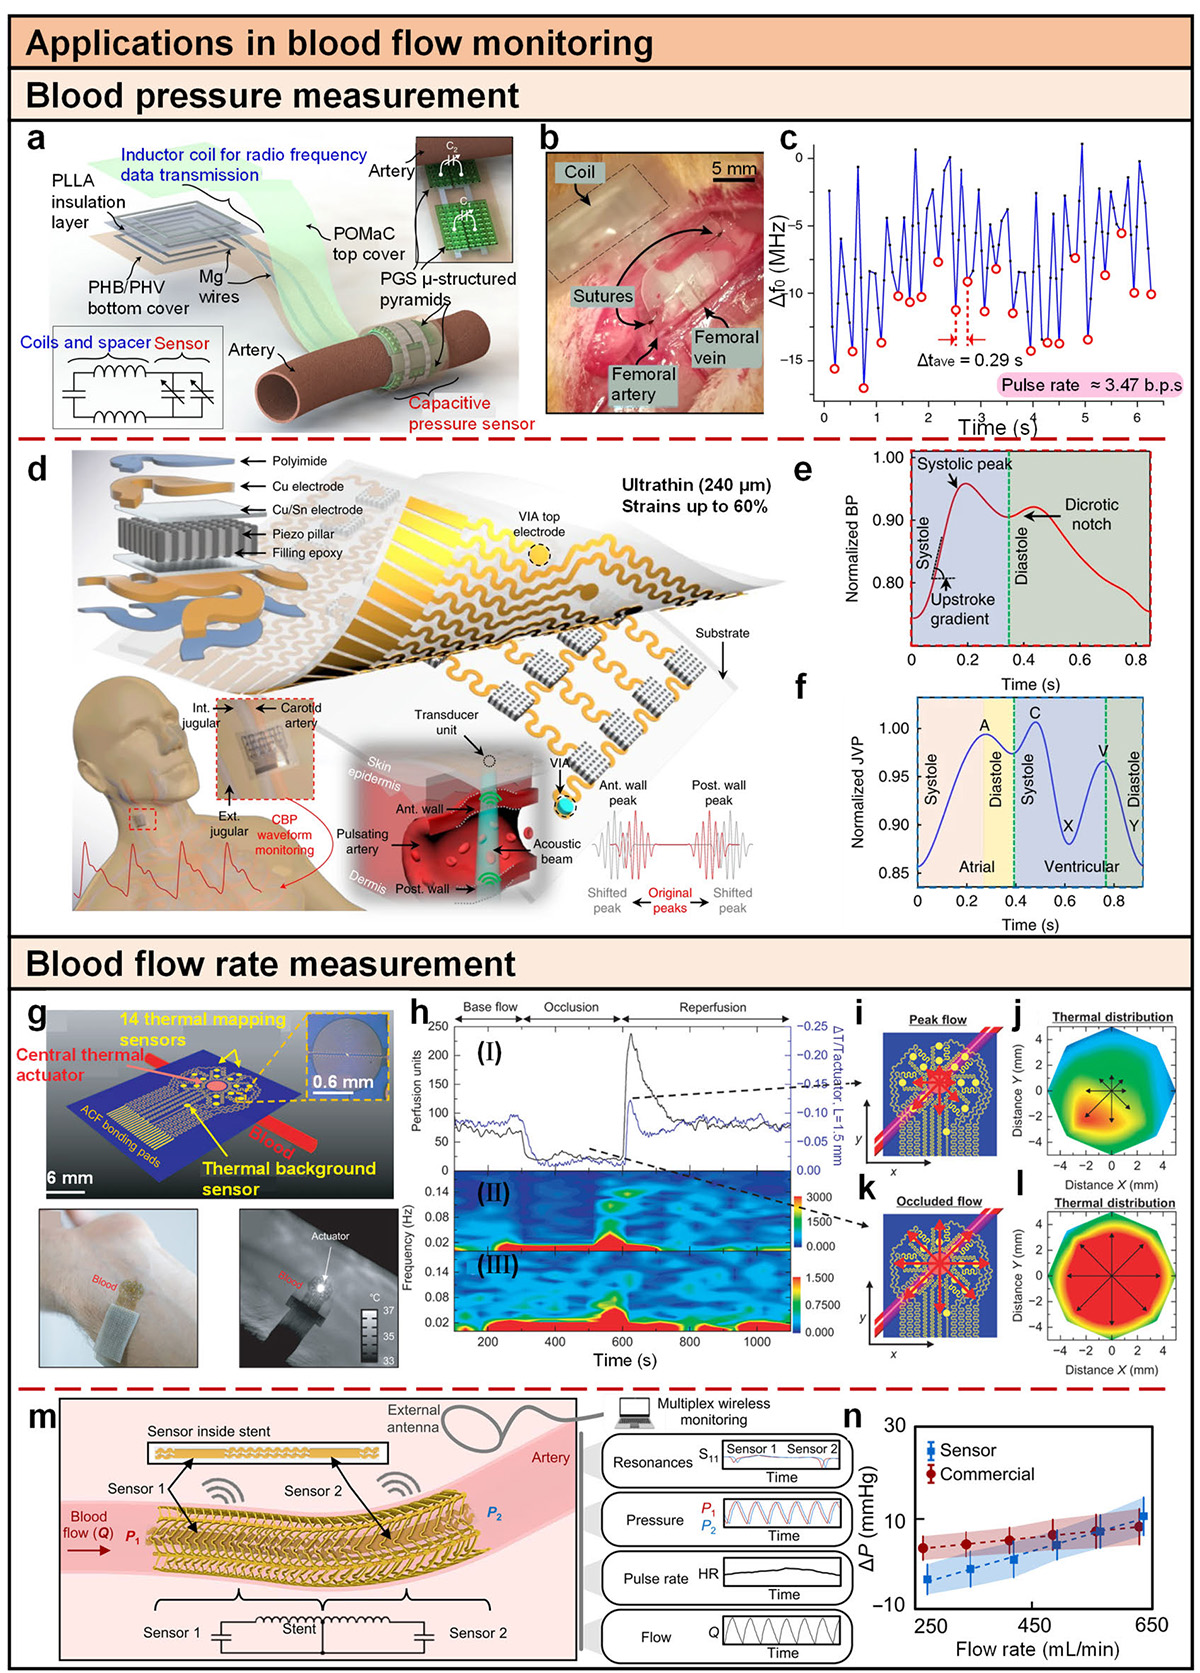
Applications in blood flow monitoring. (a) Illustration of the sensor with an exposed view of the bilayer coil structure for wireless data transmission, the cuff-type pulse sensor wrapped around the artery, a close-up view of the pressure-sensitive region of the sensor with the two variable capacitors C1 and C2 before they are wrapped around the artery, and its equivalent electrical circuit [85]. (b) Image of an implant site where the sensor is implanted and the skin stitched; the reader antenna is placed in close proximity to the antenna of the implant for Δf0 recordings [85]. (c) Plot of measured Δf0 versus time; the pulse rate is calculated to be 3.47 b.p.s [85]. (d) Schematics of the stretchable ultrasonic device, with key components labelled [86]. (e) A typical pulse waveform measured from the carotid artery, directly correlated to the left atrial and ventricular events [86]. (f) A typical pulse waveform from the internal jugular vein, directly correlated to the right atrial and ventricular activities. Different phases and characteristic morphologies are marked [86]. (g) Schematic illustration of the device layout, with a photograph and an infrared image of a device on the skin over a vein, during application of power to the actuator [34]. (h) (I) Changes in blood flow as measured by a laser speckle contrast imager (LSCI, black) and our device (blue). (II and III) Fourier transform spectrogram determined from (II) LSCI data (FFT length = 128 s, five samples per second; the color bar is the amplitude of the LSCI spectrogram) and (III) presented device (FFT length = 128 s, two samples per second; the color bar is the amplitude of the thermal anisotropy spectrogram) [34]. (i) Illustration of the position of the vein relative to the device and flow field map. The red arrows show the relative magnitudes of the thermal distribution at peak flow [34]. (j) Full thermal distribution map during peak flow as measured by the presented device [34]. (k) and (l) Similar analyses as (i) and (j), except during occluded flow [34]. (m) Illustration of the wireless design and sensing scheme to simultaneously monitor pressure, heart rate (HR), and flow [87]. (n) Summary of wireless flow monitoring comparing the pressure gradients monitored by the wireless sensor and commercial sensors [87].
Current usage metrics show cumulative count of Article Views (full-text article views including HTML views, PDF and ePub downloads, according to the available data) and Abstracts Views on Vision4Press platform.
Data correspond to usage on the plateform after 2015. The current usage metrics is available 48-96 hours after online publication and is updated daily on week days.
Initial download of the metrics may take a while.