Figure 2
Download original image
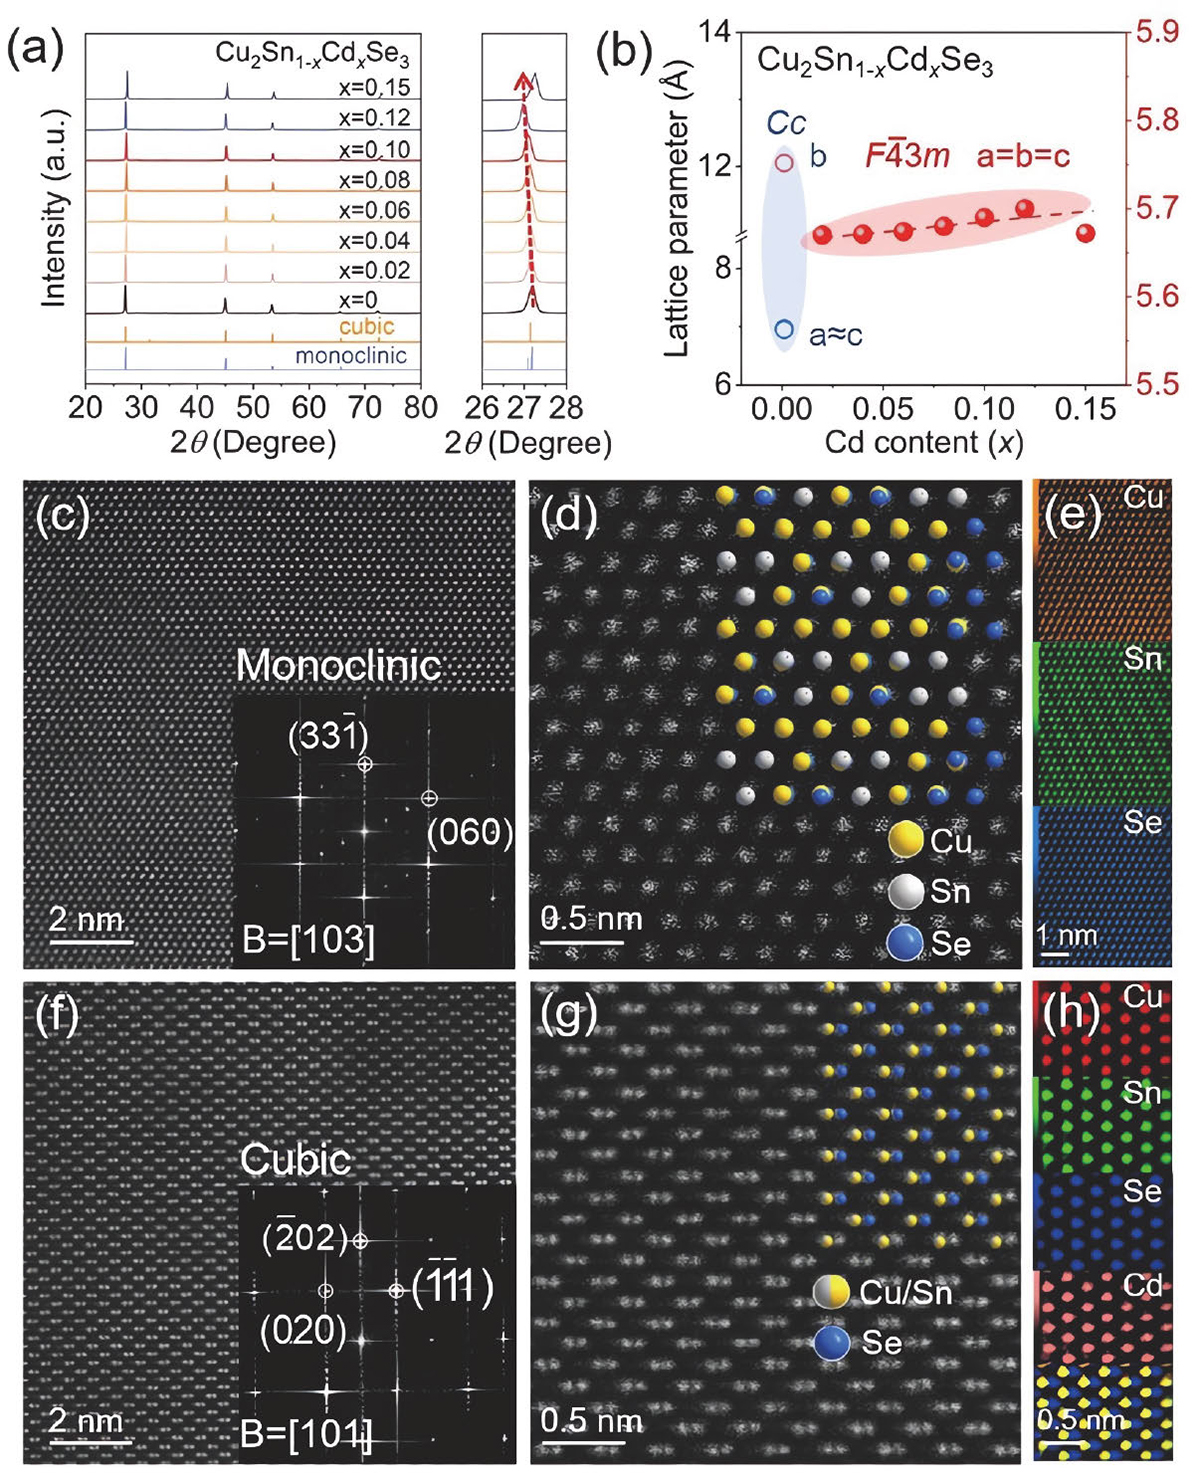
Comparison of crystal structure and microstructure between monoclinic and cubic Cu2SnSe3. (a) XRD patterns of Cu2Sn1−xCdxSe3 (x varies from 0 to 0.15). The right panel shows an enlarged view of the main Bragg peak at 27°. (b) Lattice parameters as a function of x. (c), (d) Atomic-resolution HAADF images of pristine Cu2SnSe3. Corresponding SAD pattern taken along the [103] zone axis in (c); lattice model of the monoclinic structure in (d); atomic positions and distribution in (e). (f), (g) Atomic-resolution HAADF images of Cu2Sn0.9Cd0.1Se3. Corresponding SAD pattern taken along the [101] zone axis in (f); lattice model of the cubic structure in (g); atomic positions and distribution in (h).
Current usage metrics show cumulative count of Article Views (full-text article views including HTML views, PDF and ePub downloads, according to the available data) and Abstracts Views on Vision4Press platform.
Data correspond to usage on the plateform after 2015. The current usage metrics is available 48-96 hours after online publication and is updated daily on week days.
Initial download of the metrics may take a while.