Figure 7
Download original image
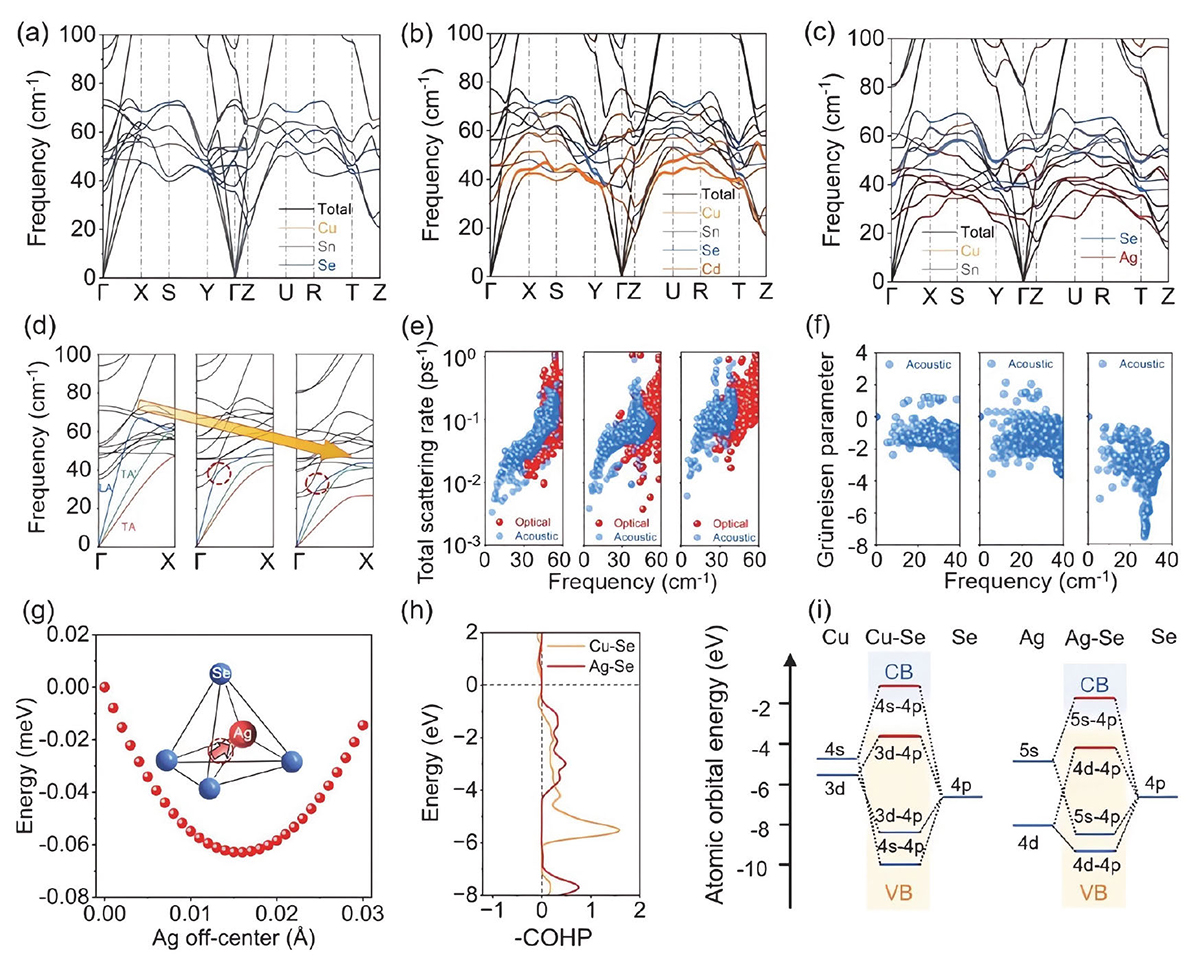
Origin of acoustic-optical phonon coupling in Cu2SnSe3. DFT-calculated phonon dispersions for (a) pristine, (b) Cd-doped, and (c) Ag-alloyed Cu2SnSe3. (d) Comparison of phonon dispersions along ΓX direction for pristine (left), Cd-doped (middle) and Ag-alloyed (right) Cu2SnSe3. The gradually softening transverse acoustic branches (TA and TA′) and longitudinal acoustic branch (LA) along with significant acoustic-optical coupling (red circles) are shown in the figure. (e) Comparison of total scattering rate within low-frequency phonons ranges for pristine (left), Cd-doped (middle) and Ag-alloyed (right) Cu2SnSe3. (f) Comparison of Grüneisen parameter for pristine (left), Cd-doped (middle) and Ag-alloyed (right) Cu2SnSe3, indicating the increased anharmonic lattice vibration from acoustic phonons. Energy profile of (g) Ag atom substituting Cu at different positions. The x = 0 suggests that the atom occupies the center of the Se tetrahedron; the calculated result shows that the off-centered Ag atoms displace 0.016 Å away from the center of the Se tetrahedron. (h) The crystal orbital Hamiltonian populations (COHP) are classified by different chemical bonds for Cu‒Se and Ag‒Se. (i) The schematic atomic orbital hybridization for Cu‒Se and Ag‒Se bonding, where the atomic orbital energy of Cu, Ag, and Se are obtained from NIST database LDA calculations [69]. The corresponding energy of bonding states is deduced from the atomic orbital energies.
Current usage metrics show cumulative count of Article Views (full-text article views including HTML views, PDF and ePub downloads, according to the available data) and Abstracts Views on Vision4Press platform.
Data correspond to usage on the plateform after 2015. The current usage metrics is available 48-96 hours after online publication and is updated daily on week days.
Initial download of the metrics may take a while.