Figure 3
Download original image
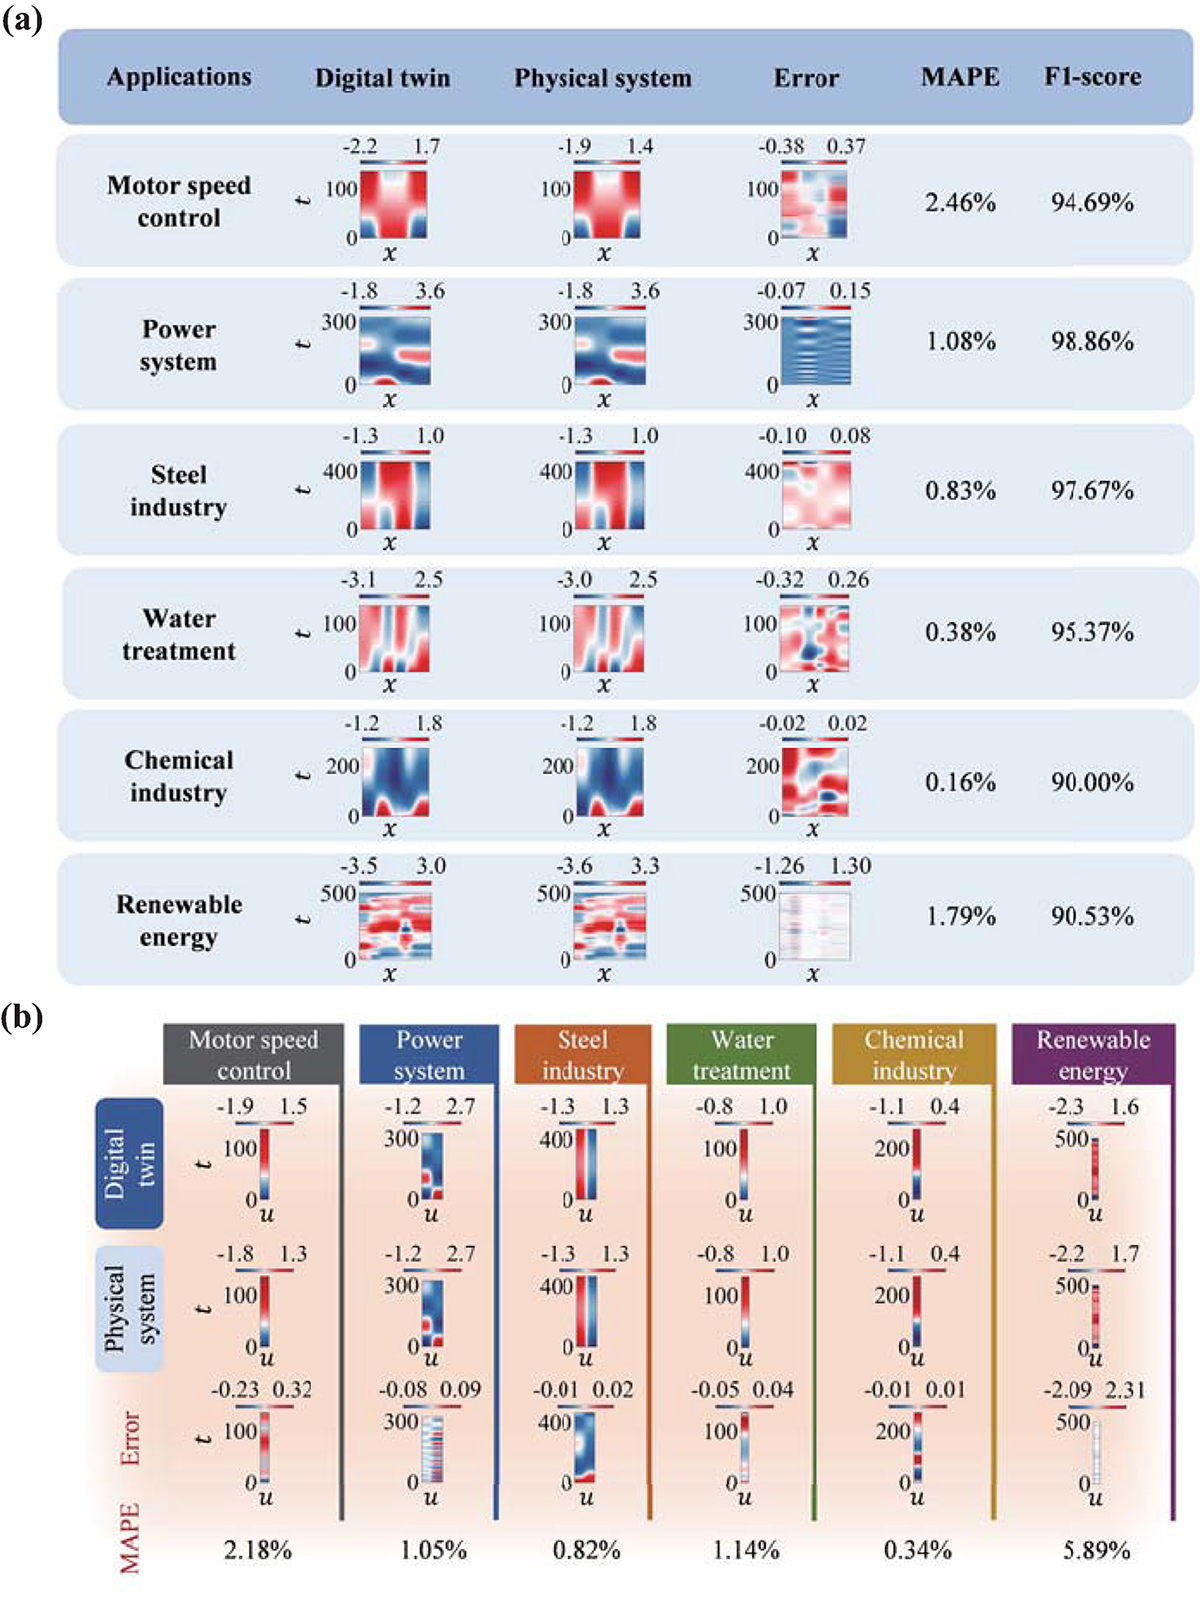
Overview of the testing outcomes for the PINL implemented across various ICSs. The PINL has been deployed across six representative ICSs. The y-axis is the time step, with each ICS having a distinct time step length based on its control accuracy requirements, while the x-axis represents the standardized values of variables in ICSs. (a) The prediction and anomaly detection capabilities of the PINL. The second and third columns display the predicted state variables from the digital space and the actual measured values from the ICSs, respectively. The fifth column is the calculated mean absolute percentage error (MAPE) for the prediction results. The final column reports the F1-score for anomaly detection, quantifying the DT's accuracy in distinguishing between normal and abnormal operational states. (b) The decision-making efficacy of the PINL.
Current usage metrics show cumulative count of Article Views (full-text article views including HTML views, PDF and ePub downloads, according to the available data) and Abstracts Views on Vision4Press platform.
Data correspond to usage on the plateform after 2015. The current usage metrics is available 48-96 hours after online publication and is updated daily on week days.
Initial download of the metrics may take a while.