| Issue |
Natl Sci Open
Volume 4, Number 5, 2025
|
|
|---|---|---|
| Article Number | 20250027 | |
| Number of page(s) | 21 | |
| Section | Earth and Environmental Sciences | |
| DOI | https://doi.org/10.1360/nso/20250027 | |
| Published online | 05 September 2025 | |
RESEARCH ARTICLE
Cellular uptake and distribution of black phosphorus nanosheets in A549 cells: Effects on cellular metabolism and mitochondrial function
1
State Key Laboratory of Pollution Control and Resource Reuse, School of the Environment, Chemistry and Biomedicine Innovation Center, Nanjing University, Nanjing 210093, China
2
Nanjing Qixia District Hospital, Nanjing 210033, China
3
School of Environmental Science and Engineering, Zhejiang Gongshang University, Hangzhou 310018, China
4
SCIEX, Analytical Instrument Trading Co., Ltd., Shanghai 201100, China
* Corresponding author (email: This email address is being protected from spambots. You need JavaScript enabled to view it.
)
Received:
21
June
2025
Revised:
17
August
2025
Accepted:
4
September
2025
Abstract
Black phosphorus nanosheets (BPNSs) show great potential in medical applications; however, their intracellular behavior and toxic effects should not be ignored once they are introduced into the human body. Fluorescence labeling technology was utilized to visualize their uptake and distribution in A549 (human non-small cell lung cancer cells) cells, and the influence of their sizes was also investigated. This study reveals that small-sized BPNS (SBPNS) and large-sized BPNS (LBPNS) enter cells through macropinocytosis and caveolae-dependent endocytosis, respectively. Moreover, BPNS were found to localize in lysosomes (4.17 ± 0.69 μg), the Golgi apparatus (7.65 ± 1.20 μg), and mitochondria (37.20 ± 7.10 μg). Next, the transfer of BPNS to mitochondria causes mitochondrial dysfunction and metabolic disorders, as evidenced by decreased Ca2+ levels, decreased mitochondrial membrane potential, cell cycle arrest in S and G2/M phases, and increased ROS (reactive oxygen species) levels. The above conclusions provide important basic data to promote the application of BPNS in biomedical fields.
Key words: black phosphorus nanosheets / health risks / biosafety / biodistribution / cellular effects
© The Author(s) 2025. Published by Science Press and EDP Sciences.
 This is an Open Access article distributed under the terms of the Creative Commons Attribution License (https://creativecommons.org/licenses/by/4.0), which permits unrestricted use, distribution, and reproduction in any medium, provided the original work is properly cited.
INTRODUCTION
Black phosphorus nanosheets (BPNS), an inorganic nanomaterial composed of a single phosphorus element, attract substantial interest among scientists because of their excellent physicochemical properties, such as high surface activity, adjustable bandgap, excellent electrical conduction, and good biocompatibility [1–3]. Numerous studies have demonstrated that BPNS have great potential in biomedical fields, including biosensing, disease diagnosis and tumor therapy [4–10]. However, recent studies have also gained controversial findings regarding the biosafety of BPNS in biomedical applications. For example, some reports highlight the promising potential of BPNS in cancer therapy, emphasizing their effectiveness as multifunctional delivery platforms for targeted chemotherapy, gene therapy, and photothermal therapy, when loaded with doxorubicin and P-gp siRNA for multidrug-resistant cancers [11]. In addition, Sun et al. [12] demonstrated a linear relationship between the photoacoustic signal of BPNS and their concentration. They employed PEGylated BPNS for photoacoustic imaging of the liver, kidney, and tumors. Kumar et al. [13] utilized poly-L-lysine (PLL) functionalized BPNS for the detection of the cardiac biomarker myoglobin. Their method achieved a minimum detection limit of around 0.528 pg/mL and a dynamic detection range spanning from 1 pg/mL to 16 μg/mL. However, other research suggests that BPNS may pose potential cytotoxic risks. For instance, continuous gastric administration of BP (1 mg/kg) in mice can lead to significantly elevated blood glucose levels and induce glucose metabolism disorders and insulin resistance in muscles [14]. Furthermore, upon exposure to human exvillous trophoblast, BPNS (60 μg/mL) causes an increase in iron ion concentration, elevation of the iron death marker GPX4, and an increase in lipid peroxidation index. These changes ultimately lead to ferroptosis in the cell [15]. Despite having the same elemental composition, black phosphorus exhibits higher cytotoxicity compared to red and purple phosphorus. Cells exposed to 25 μg/mL of red or purple phosphorus for 24 h demonstrated a survival rate exceeding 70%; in contrast, cells treated with an equivalent concentration of black phosphorus exhibited a survival rate below 60%. Furthermore, cells exposed to black phosphorus produced via vapor deposition showed a 20%–30% lower survival rate compared to those treated with black phosphorus synthesized through high-pressure methods [16]. Therefore, although the biomedical applications of BPNS have been considered promising, the understanding of their cellular behaviors and the evaluation of their cytotoxic effects are urgently required.
The biological processes of nanomaterials are closely related to their biological effects [17]. For instance, RAW 264.7 cells internalize cationic polystyrene nanospheres via the endosomal-lysosomal pathway, exhibiting apoptotic features. In contrast, BEAS-2B cells uptake the same polystyrene nanospheres through clathrin-dependent endocytosis, showing signs of necrosis [18]. The study demonstrated that graphene oxide may be internalized via macropinocytosis or clathrin-dependent endocytosis pathways [19]. After being internalized through endocytosis, fluorescein isothiocyanate labeled graphene oxide nanoassembly (GO/PLL-FITC/PSS) were predominantly localized to mitochondria and lysosomes; however, no significant alterations in lysosomal enzyme activity or mitochondrial membrane potential were observed [20]. However, research on the relationship between the biological processes and effects of BPNS remains limited, which restricts a comprehensive evaluation of their biological effects. Therefore, investigating the internalization of BPNS by cells and their subsequent distribution within cells is crucial for a deeper understanding of the biological effects of BPNS.
It is worth noting that, during the production of nanomaterials, their sizes are always non-uniform, ranging from a few nanometers to hundreds of nanometers [21,22]. Many studies have demonstrated that the size of nanomaterials significantly impacts their biological processes and effects [23,24]. For example, the protein-modified large-sized (0.86 ± 0.37 μm) and small-sized (0.42 ± 0.26 μm) graphene oxide nanosheets were primarily internalized through phagocytosis and clathrin-dependent endocytic pathways, as demonstrated in this study. Reduced intracellular internalization efficiency was observed in small-sized nanosheets during endocytosis, and this suppressed uptake effectively alleviated their inherent strong cytotoxic properties [25]. Furthermore, compared to rhodamine B labeled chitosan hydrochloride grafted NPs (RhB-CHNP) (150 nm), the macrophage uptake of RhB-CHNP (300 nm) increased by 1.1-fold. This increase in uptake may be attributed to the disruption of cellular membrane structures. In addition, only RhB-CHNP (150 nm) at a concentration of 1 mg/mL exhibited significant cytotoxicity [26]. However, studies specifically investigating the impact of black phosphorus nanosheet size on its biological processes and effects remain insufficient. Therefore, it is necessary to explore the influence of BPNS’ sizes on their biological processes and biological effects.
In this study, we synthesized two different sizes of BPNS using ultrasonication and gradient centrifugation. Then, we systematically investigated the internalization of BPNS by cells and their subsequent distribution within cells with the help of fluorescence labeling and gold nanoparticle labeling. Additionally, we further investigated the impact of BPNS on mitochondrial function and cellular metabolism. In conclusion, our research is crucial for a deeper understanding of the biological processes and subsequent biological effects of BPNS, and it also provides strong support for advancing their applications in the biomedical field.
EXPERIMENTAL SECTION
Materials
Bulk black phosphorus was purchased from Nanjing Xianfeng Nanomaterials Co. Ltd. (Nanjing, China). N-(3-dimethylaminopropyl)-N′-ethylcarbodiimide hydrochloride (EDC), N-hydroxysuccinimide (NHS), Amiloride hydrochloride hydrate (Amiloride), methyl-β-cyclodextrin (MβCD), and Dynasore (initiator protein inhibitor) were purchased from Sigma-Aldrich (Shanghai, China). BSA-FITC (BSA: bovine serum albumin, ), Lyso Tracker Red DND-99 (Lysosomal red fluorescent probe) was purchased from Dalian Meilun Biotechnology Co. Ltd. (Dalian, China). ER-Tracker Red (Endoplasmic reticulum red fluorescent probe), Golgi-Tracker Red (Golgi-Red fluorescent probe), DMSO (Dimethyl sulfoxide), F12K (Cell culture medium), Hoechst (Blue fluorescent dye for cell nuclei), and DiD (Red fluorescent dye for cell membranes) were purchased from KAIJI Biotechnology Co. Ltd. (Nanjing, China). DCFH-DA (ROS detection kit) was purchased from Wuhan SERVICE Biotechnology Co. Ltd. (Wuhan, China). CMX Ros (Mito-Tracker Red), sodium citrate solution and tetrachloroauric acid solution were purchased from Shanghai Beyotime Biotechnology Co. Ltd. (Shanghai, China). JC-10 (Mitochondrial membrane potential probe) was purchased from WARBIO Biotechnology Co. Ltd. (Nanjing, China). Fluo-4 AM (Ca2+ fluorescent probe), RNaseA-PI, multi-element mixed standard solution (100 μg/mL) and Au standard solution were purchased from Nantong FEIYU Biotechnology Co. Ltd. (Nantong, China). Other reagents were purchased from Nanjing Chemical Reagent Co. Ltd. (Nanjing, China).
Cell culture
A549 (human non-small cell lung cancer cells) were inoculated in F12K medium supplemented with 10% fetal bovine serum, 100 U/mL penicillin, 100 μg/mL streptomycin, 1260 mg/L D-glucose, and 220 mg/L sodium pyruvate and cultured in a humidified incubator at 37°C with 5% CO2.
Preparation of BPNS and BPNS-BSA-FITC
In an anaerobic environment, 33 mg of black phosphorus crystals were placed into an agate and ground for 30 min to produce black phosphorus powder. The 5 mL of oxygen-free ultrapure water was added into the agate mortar and then continued grinding for another 30 min. Then, 95 mL oxygen-free ultrapure water was added to the mixture, which was placed in an ice-water bath and sonicated using a probe for 40 h (power: 750 W, on/off cycle: 6 s/3 s). Then, the mixture was sonicated in a water bath for an additional 10 h. The resulting mixture was centrifuged at speeds ranging from 7000 to 12,000 r/min to obtain large-sized BPNS (LBPNS). Under the same preparation conditions, small-sized BPNS (SBPNS) was obtained by probe sonication for 60 h, water bath sonication for 10 h and centrifugation at 7000–12,000 r/min.
LBPNS (100 μg) was dispersed in 2 mL of H2O containing 30 mg EDC and 60 mg NHS, then stirred for 2 h. 2 mL of BSA-FITC (BSA: 0.1432 mg/mL, FITC: 1.783 μg/mL) was added into the mixture and continued stirring in darkness under sealed conditions for 24 h. The mixture was centrifuged at 12,000 r/min and washed several times with ultrapure water to remove excess BSA-FITC. The precipitate was named FITC-labeled large-sized BPNS (LBPNS-BSA-FITC). Similarly, the precipitate prepared from SBPNS was named FITC-labeled small-sized BPNS (SBPNS-BSA-FITC).
Characterization of BPNS and BPNS-BSA-FITC
Atomic force microscopy (AFM) measurements were carried out using a Multimode 8-HR Brochure (BRUKER Company, Germany) to probe the dimensions and height of the material. Using a JEOL JEM 2800 (JEOL Company, Japan) transmission electron microscope (TEM), pictures were taken to observe the morphology of the material. The emission spectra of different sizes of materials (2 mL, 50 μg/mL) were measured at an excitation wavelength of 490 nm and the corresponding intensity of emission at 520 nm using a HITACHI F-7000 (HITACHI Company, Japan) fluorescence spectrophotometer to probe the stability of fluorescent effects of fluorescent dyes, the stability of modifications, and calculation of loading amounts in the Supporting information. The Fourier transform infrared spectra (FTIR) of the materials were obtained using a VERTEX 70V FTIR spectrometer (BRUKER Company, Germany). X-ray photoelectron spectroscopy (XPS) of materials was executed using a PHI 5000 VERSAPROBE III (ULVAC-PHI Company, Japan) X-ray photoelectron spectrometer to investigate the constituent elements of materials and chemical bonding. Fluorescence pictures of materials as well as cells were taken using a NIKON ECLIPSE (Nikon Company, Japan) inverted fluorescence microscope at an excitation wavelength of 488 nm at 50% laser intensity. The Raman spectra of materials were measured using a HORIBA XPLORAPLUS Micro-Raman spectrometer (HORIBA Company, Japan). The electrodynamic potentials of the materials were measured in different environments at pH 7.4 using a Be Nano 180 Zeta Pro (DANDONGBAITE Company, China).
Uptake of SBPNS and LBPNS by cells
Cells were seeded at a density of 10 × 104 cells per well in fluorescence confocal dishes and allowed to incubate for 24 h. Subsequently, the cells were treated with either LBPNS-BSA-FITC or SBPNS-BSA-FITC (2.5 μg/mL) for another 24 h. After that, cells were washed three times using PBS (phosphate-buffered saline). Following the manufacturer’s protocol, cells were then sequentially stained with 4 μM (1 M=1 mol/L) Hoechst fluorescent dye (for the nucleus) and 5 μM DiD fluorescent dye (for the cell membrane) for 30 min. Following a final PBS rinse, confocal fluorescence microscopy imaging was performed using a Leica TCS SP5 (Leica Company, Germany) to evaluate the intracellular uptake of BPNS. The cellular uptake of LBPNS or SBPNS was also characterized using TEM, as described in the Supporting information.
Cells were seeded at a density of 15 × 104 cells per well and incubated for 24 h. Subsequently, the cells were exposed to LBPNS-BSA-FITC or SBPNS-BSA-FITC at concentrations of 2.5, 5, and 10 μg/mL for different times (0, 2, 4, 8, 10, 12, 24, and 34 h). Fluorescence microscopy (NIKON ECLIPSE, Nikon Company, Japan) was employed to visualize the uptake of black phosphorus by the cells, in a light-controlled environment. Imaging parameters included an excitation wavelength of 488 nm, with the fluorescence voltage at 50%, gain at 200%, and an exposure time of 3000 ms. Additionally, flow cytometry analysis was conducted on 1 × 10⁴ cells using a BD LSR FORTESSA flow cytometer (Becton Dickinson and Company, America).
Cells were seeded at a density of 15 × 104 cells per well in a 6-well plate. After 24 h of incubation, cells were treated for 2 h with the following regimen: Amiloride (40 μg/mL), MβCD (2 mM), and Dynasore (3 μg/mL). After the treatment, the cells were exposed to either LBPNS-BSA-FITC or SBPNS-BSA-FITC (10 μg/mL) for 12 h. Following exposure, the cells were collected and analyzed using the FITC channel of a BD LSR FORTESSA (Becton Dickinson and Company, America) to determine the percentage of positive cells relative to the total cell count. The method of CCK-8 Cell toxicity of Ingestion Inhibitors is described in the Supporting information.
Distribution of SBPNS and LBPNS in cells
Cells were seeded at a density of 10 × 104 cells per well in a fluorescence confocal dish and cultured for 24 h. Subsequently, they were exposed to either LBPNS-BSA-FITC or SBPNS-BSA-FITC (2.5 μg/mL) for 24 h. 60 nM Lyso Tracker Red DND-99 (lysosomal red fluorescent probe), 100 nM CMX Ros (Mito-Tracker Red), 10 nM ER-Tracker Red (endoplasmic reticulum red fluorescent probe), and 500 nM Golgi-Tracker Red (Golgi-red fluorescent probe) were exposed to the cells for 30 min. Subsequently, cells were stained with 4 μM Hoechst nuclear stain for 30 min. Finally, the Leica TCS SP5 microscope (Leica Company, Germany) was employed for fluorescence confocal microscopy imaging to observe the distribution of BPNS within the cells. Fluorescence confocal images were analyzed using ImageJ software to assess colocalization between the green fluorescence of LBPNS-BSA-FITC or SBPNS-BSA-FITC and the red fluorescence signals from lysosomes, endoplasmic reticulum, Golgi apparatus, mitochondria, and blue fluorescence signals from cell nuclei. Colocalization coefficients (Pearson’s R value) were calculated accordingly. Additionally, the methods of TEM images and elemental dot mapping of SBPNS and LBPNS distribution within cells are described in the Supporting information.
Effects of BPNS on ROS level, Ca2+ level, and MMP
Cells were seeded at a density of 5 × 10³ cells per well and incubated for 24 h. Subsequently, the cells were exposed to LBPNS (10, 5, and 2.5 μg/mL) for 24 h. Following the exposure period, each well received 50 μL of Fluo-4 AM (Ca2+ fluorescent probe) working solution (4 μM) for 50 min. Following this incubation, the cells were washed three times with PBS, and the fluorescence intensity at an excitation wavelength of 494 nm and an emission wavelength of 516 nm was measured using the Infinite M200PRO (TECAN Company, Switzerland).
According to the above-mentioned cell seeding method, the cells were exposed to BPNS (10 and 5 μg/mL) for 24 h. Subsequently, 100 μL of JC-10 working solution (Mitochondrial membrane potential probe) (30 μM) was added to each well. Using an Infinite M200PRO (TECAN Company, Switzerland), the fluorescence intensity was measured at 525 and 590 nm emission wavelengths. Moreover, the fluorescence patterns of the cells under 488 and 540 nm excitation wavelengths were observed by NIKON ECLIPSE (Nikon Company, Japan) in a dark environment.
According to the above-mentioned cell seeding method, the cells were exposed to LBPNS or SBPNS (5 μg/mL) for 24 h. Subsequently, 1000 μL of DCFH-DA (ROS detection kit) working solution was added to each well. Following the incubation, the cells were washed three times with PBS and then treated with trypsin for dissociation. After filtering the cell suspension through a 40 μm cell strainer, the cells were analyzed using the FITC channel of a BD LSR FORTESSA (Becton Dickinson and Company, America).
Metabolomics
Cells were seeded at a density of 10 × 104 cells per well and incubated for 24 h. Subsequently, the cells were exposed to either cell culture medium (F12K) or LBPNS (2.5 μg/mL) for 24 h. After exposure, the cells were washed three times with PBS and treated with trypsin for dissociation. Following centrifugation at 1000 r/min, 200 × 104 cells were collected and rapidly frozen in liquid nitrogen. Metabolomics analysis was performed on the cells subjected to abrupt termination. The metabolomics detection method is described in the Supporting information.
Software and statistical analysis
SPSS 18.0 (PASW Statistics, IBM Corp.) was used for statistical analysis. Differences were considered statistically significant at p < 0.05. One-way analysis of variance (ANOVA), t-test, and Tukey post hoc test were used for data analysis (Samples were sorted from high to low based on the significance of the mean differences and labeled as a, b, c, etc). ImageJ (National Institutes of Health) was used for fluorescence confocal image processing and co-localization analysis. The data collected by LC-QTOF-MS were matched and analyzed using SCIEX OS software, and the identified metabolite information was subjected to differential analysis (VIP > 1) and metabolic pathway analysis using MetaboAnalyst 5.0 software.
RESULTS AND DISCUSSION
Characterization of BPNS and BPNS-BSA-FITC
Using different durations of probe ultrasonication, two distinct sizes of black phosphorus nanosheets (BPNS) were produced. The size and morphology of large-sized BPNS (LBPNS) and small-sized BPNS (SBPNS) were characterized by AFM, and a sheet-like morphology with well-defined edges was observed in BPNS (Figure 1a and d), which was also confirmed by TEM images (Figure S1g and h in the Supporting information). The lateral size distribution of SBPNS was primarily clustered between 15 and 30 nm, with a peak at approximately 25 nm, while LBPNS was predominantly in the range of 30 to 70 nm, with a peak at approximately 50 nm (Figure 1c and f). Additionally, the average thicknesses of SBPNS and LBPNS were determined to be 1.58 ± 0.68 and 2.45 ± 0.19 nm, respectively (Figure 1b and e). In this study, the exfoliation of bulk black phosphorus into nanosheets was achieved through top-down methods. Next, the Zeta potential of BPNS in PBS at pH 7.4 was measured as −27.56 ± 1.11 eV, suggesting that BPNS exhibited good stability in PBS (Figure 2f). Additionally, the negative charge of BPNS also facilitated the subsequent modification with BSA-FITC.
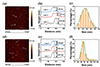 |
Figure 1 Preparation of BPNS. (a) Representative AFM morphology of SBPNS. (b) Thickness of SBPNS (n = 3). (c) Histogram of SBPNS size distribution. (d) Representative AFM morphology of LBPNS. (e) Thicknesses of LBPNS (n = 3). (f) Histogram of LBPNS size distribution. Histograms were developed by counting each sample (200–300) with shown Gaussian fitted curves. |
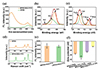 |
Figure 2 Characterization of BPNS and BPNS-BSA-FITC. (a) Fluorescence spectra of BPNS and BPNS-BSA-FITC (EX = 490 nm). (b) N1s spectra of BPNS-BSA-FITC samples characterized by XPS. (c) P2p spectra of BPNS-BSA-FITC samples characterized by XPS. (d) Raman spectra of BPNS and BPNS-BSA-FITC. (e) Fluorescence intensity of SBPNS-BSA-FITC and LBPNS-BSA-FITC (Ex = 490 nm, Em = 520 nm, n = 3). (f) Zeta potential of BPNS and BPNS-BSA-FITC in different environments (n = 3). |
To impart fluorescence to BPNS, BSA-FITC was used for the modification, resulting in BPNS-BSA-FITC. This modification not only imparted BPNS with fluorescent properties but also simulated the formation of a protein corona, as BPNS were enveloped by proteins in the bloodstream. BSA-FITC labeling was shown to be stable and useful in investigating cellular uptake of silver nanoparticles, PLGA nanoparticles, and cationic PLA nanoparticles, with little potential to interfere with cellular uptake of BPNS [27–29]. This approach was advantageous for the study of BPNS cellular uptake by lung cancer cells under physiological conditions and their distribution within cellular organelles [30,31]. It was shown that the lamellar morphology of BPNS-BSA-FITC was maintained. (Figure S1a and d in the Supporting information). The statistical lateral dimensions of FITC-labeled small-sized BPNS (SBPNS-BSA-FITC) and FITC-labeled large-sized BPNS (LBPNS-BSA-FITC) were measured to be approximately 28 and 53 nm, respectively (Figure S1c and f in the Supporting information), with average thicknesses of 3.75 ± 0.29 and 4.49 ± 0.06 nm (Figure S1b and e in the Supporting information). The surface morphology of BPNS-BSA-FITC was observed to be more rounded, with a slight increase in both lateral size and thickness compared to bare BPNS, which was attributed to the chemical bonding of BSA to the BPNS surface [32]. However, the negligible increase in lateral size indicated that the overall size of BPNS has not been significantly altered by the modification process.
As illustrated in Figure 2a, distinct emission peaks at 525 and 608 nm were displayed in the fluorescence spectrum of BPNS-BSA-FITC, whereas a single emission peak at 608 nm was shown in the fluorescence spectrum of BPNS. This suggested that the peak at 525 nm corresponded to the green fluorescence emitted by FITC. XPS analysis of BPNS-BSA-FITC was shown in Figure 2b and c. Three distinct peaks are observed in the N1s spectrum at binding energies of 403.6, 400.8, and 399.8 eV, corresponding to N−C, N−H, and N−P, respectively [33]. Additionally, a well-defined P2p signal was observed, which was deconvoluted into two binding energy signals, P2p1/2 and P2p3/2, at approximately 130.1 and 129.1 eV, respectively. The signal centered around 134.8 eV was attributed to the oxidized state of phosphorus, while the signal centered around 133.8 eV was ascribed to the P−N bond formed during the binding of BSA-FITC to BPNS [21,34]. These observations strongly suggested that successful binding of BSA-FITC to the surface of BPNS has been achieved.
The FTIR analysis of BPNS-BSA-FITC revealed characteristic absorption peaks: approximately 1640 cm−1, corresponding to the N−H stretching mode; strong and broad peaks at around 3307 and 2930 cm−1, associated with the O=P−N−H and C−H stretching modes, respectively; a peak at approximately 1460 cm−1, corresponding to the P−N stretching mode [35–39]. These corresponding peaks were not observed in the FTIR spectra of BPNS (Figure S2a and b in the Supporting information). These results were consistent with the findings from the fluorescence spectrum and XPS. As shown in Figure 2d, the Raman spectrum of BPNS was characterized by peaks: the out-of-plane phonon mode  at 360.40 cm−1, and the in-plane modes B2g and
  at 435.05 and 461.40 cm−1, respectively. The Raman peaks corresponding to
  , B2g, and
  modes in BPNS-BSA-FITC were found to be consistent with those in the Raman spectrum of BPNS, indicating that no structural changes in BPNS have been caused by the modification with BSA-FITC [40].
The fluorescence of BPNS-BSA-FITC was observed by inverted fluorescence microscopy, revealing prominent green fluorescence, consistent with the fluorescence spectrum results (Figure S2c and d in the Supporting information). Fluorescence loading rates of SBPNS-BSA-FITC and LBPNS-BSA-FITC were determined to be 8.56 ± 0.51 and 5.70 ± 0.34 ng/μg, respectively (Figure S3a in the Supporting information). This difference in loading rates was attributed to the larger surface area of SBPNS compared to LBPNS, which facilitated the binding of more BSA-FITC. Despite the higher binding of BSA-FITC to SBPNS, no significant difference in fluorescence intensity was observed between SBPNS-BSA-FITC and LBPNS-BSA-FITC (P > 0.05) (Figure 2e). This phenomenon was likely due to aggregation-induced quenching, where fluorescence intensity stabilized after reaching a certain saturation point [41,42]. The stability of BSA-FITC binding to BPNS was assessed by evaluating the fluorescence intensity ratio of centrifuged and washed BPNS-BSA-FITC to the initial fluorescence intensity. It was observed that the fluorescence intensity ratio stabilized close to 1 within 24 h, indicating stable binding of BSA-FITC to BPNS (Figure S3f). Furthermore, fluorescence intensity measurements of BPNS-BSA-FITC showed that fluorescence intensity remained nearly constant within 24 h and up to 7 d, demonstrating excellent fluorescence stability (Figure S3d and e in the Supporting information).
The Zeta potentials of BPNS-BSA-FITC were measured to be −35.52 ± 3.45, −23.30 ± 1.22, and −11.67 ± 0.75 eV in ultrapure water, PBS, and cell culture medium (F12K) at pH 7.4, respectively, indicating its robust stability (Figure 2f). Overall, the successful fabrication of BPNS with two distinct sizes and the effective modification of BPNS with BSA-FITC, which imparts stable and vivid green fluorescence, were confirmed by these characterization results. The size and structure of BPNS were minimally impacted by the BSA-FITC modification, while excellent stability in different environments was ensured.
Uptake of LBPNS and SBPNS by cells
Based on the findings, bright and stable fluorescence characteristics were exhibited by BPNS-BSA-FITC, with no significant difference in fluorescence intensity noted between SBPNS-BSA-FITC and LBPNS-BSA-FITC. Consequently, BPNS-BSA-FITC had been selected as the probe for the investigation of cellular uptake of SBPNS and LBPNS at different concentrations in human non-small cell lung cancer cells (A549). Furthermore, inhibitors of endocytosis were used to examine the influence of size effects on the cellular uptake mechanism of BPNS.
Firstly, fluorescence confocal microscopy was employed to examine A549 cells that had been co-cultured with SBPNS-BSA-FITC and LBPNS-BSA-FITC for 24 h. Green fluorescence was observed, indicating the presence of SBPNS-BSA-FITC and LBPNS-BSA-FITC, while red fluorescence was used to represent the cell membrane, and blue fluorescence signified the cell nucleus. These results demonstrated that BPNS-BSA-FITC had been successfully taken up by A549 cells. Enzymatic digestion with trypsin, followed by washing with PBS (pH 7.4), effectively removed most of the BPNS-BSA-FITC that was adhered to the cell membrane, thereby confirming the reliability of using fluorescently labeled BPNS for studying cellular uptake (Figure 3a). The successful internalization of BPNS-BSA-FITC by the cells was further evidenced by TEM images, which revealed aggregates within vesicular organelles (Figure S4a–c in the Supporting information). In addition, the accumulation of SBPNS-BSA-FITC within the cells was higher than that of LBPNS-BSA-FITC.
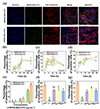 |
Figure 3 Uptake of LBPNS and SBPNS by cells. (a) Fluorescence confocal pictures of SBPNS-BSA-FITC and LBPNS-BSA-FITC inside the cell membrane. (b–d) Percentage of FITC-positive cells to total cell number in SBPNS-BSA-FITC and LBPNS-BSA-FITC (2.5, 5.0, and 10.0 μg/mL) exposed cells detected by flow cytometry (n = 3). (e) Percentage of FITC-positive cells to total cell number exposed to different concentrations of SBPNS-BSA-FITC and LBPNS-BSA-FITC for 34 h detected by flow cytometry (n = 3). (f) Percentage of FITC-positive cells to total cell number in different inhibitor-treated groups after 12 h exposure to 10 μg/mL SBPNS-BSA-FITC (n = 3). (g) Percentage of FITC-positive cells to total cell number in different inhibitor-treated groups after 12 h exposure to 10 μg/mL LBPNS-BSA-FITC (n = 3). |
Flow cytometry was further employed to assess the proportion of FITC-positive cells that were exposed to different concentrations of SBPNS-BSA-FITC and LBPNS-BSA-FITC over different periods. This proportion reflected the extent of BPNS-BSA-FITC uptake by A549 cells. As illustrated in Figure 3b–d, an increase in BPNS-BSA-FITC uptake by A549 cells was observed over time, peaking at approximately 10 h and remaining relatively stable or slightly decreasing between 10 and 24 h. Furthermore, a significantly higher uptake of BPNS-BSA-FITC was recorded at greater exposure concentrations (P < 0.05). For instance, at an exposure concentration of 2.5 μg/mL, A549 cells co-incubated with LBPNS-BSA-FITC for 10 h exhibited a FITC-positive cell proportion of 1.31% ± 0.55%, which increased to 13.47% ± 1.65% at 5 μg/mL. Additionally, a differential uptake of BPNS-BSA-FITC of varying sizes was observed, compared to LBPNS-BSA-FITC, more SBPNS-BSA-FITC was uptaken by cells (P < 0.05). For example, at an exposure concentration of 10 μg/mL, A549 cells co-incubated with SBPNS-BSA-FITC for 10 h displayed a FITC-positive cell proportion of 63.99% ± 2.45%, whereas those co-incubated with LBPNS-BSA-FITC showed a proportion of 52.21% ± 3.15%. These findings were consistent with the observations from TEM images. The observed variation in uptake was attributed to the differing sizes of SBPNS-BSA-FITC and LBPNS-BSA-FITC, which resulted in different intake patterns. As shown in Figure 3e, the disparity in cellular uptake between SBPNS-BSA-FITC and LBPNS-BSA-FITC diminished with decreasing exposure concentrations. For instance, at an exposure concentration of 10 μg/mL, after 34 h of co-incubation with SBPNS-BSA-FITC and LBPNS-BSA-FITC, the proportions of FITC-positive cells among A549 cells were 68.87% ± 0.61% and 41.19% ± 0.66%, respectively. Conversely, at a lower exposure concentration of 2.5 μg/mL, these proportions decreased to 2.84% ± 0.13% and 2.60% ± 0.55%, respectively.
Observations were conducted using inverted fluorescence microscopy to assess A549 cells that were exposed to different concentrations of SBPNS-BSA-FITC or LBPNS-BSA-FITC. A progressive increase in fluorescence intensity within A549 cells was demonstrated over time, reaching a peak at approximately 10 h, after which the fluorescence either stabilized or slightly decreased. Marginally higher fluorescence intensity was observed in cells treated with SBPNS-BSA-FITC compared to those treated with LBPNS-BSA-FITC, which corroborated the findings obtained from flow cytometry analysis (Figures S5 and S6 in the Supporting information).
The results confirmed the successful internalization of BPNS-BSA-FITC into cells, with uptake being influenced by the size and concentration of BPNS-BSA-FITC. Additionally, cells exposed to BP-PEG-FITC displayed FITC fluorescence within cellular vesicles, further indicating the uptake of BP-PEG-FITC by cells [6]. It was suggested by recent studies that BP was entered into cells primarily through macropinocytosis and caveolae-dependent endocytosis, rather than clathrin-dependent endocytosis. Consequently, the differences in uptake mechanisms between LBPNS and SBPNS will be explored in future research [6,43].
To further elucidate the size-dependent effects on A549 cell uptake of BPNS, various endocytosis inhibitors were employed: Amiloride (macropinocytosis inhibitor), MβCD (caveolae-dependent endocytosis inhibitor), Dynasore (clathrin-dependent endocytosis inhibitor), and 4°C treatment (which reduces ATP production). These inhibitors were applied in a manner that maintained cell viability while effectively blocking their respective pathways (Figure S4d in the Supporting information), allowing for the examination of LBPNS and SBPNS internalization mechanisms. As shown in Figure 3f, SBPNS-BSA-FITC-treated cells exhibited a significantly lower ratio of FITC-positive cells to total cells under 4°C conditions compared to controls (P < 0.05). This indicates that energy-dependent internalization occurred, a trend also observed for LBPNS-BSA-FITC. For A549 cells treated with SBPNS-BSA-FITC, the FITC-positive cell ratio was significantly decreased in the MβCD-treated group (31.86% ± 3.61%), Dynasore-treated group (33.74% ± 3.15%), and Amiloride-treated group (28.70% ± 1.55%) compared to controls, suggesting that SBPNS-BSA-FITC primarily followed macropinocytosis, with caveolae-dependent endocytosis also contributing. Conversely, a notable reduction in FITC-positive cell ratios was observed in LBPNS-BSA-FITC-treated cells in the MβCD-treated group (10.81% ± 1.12%), Dynasore-treated group (14.65% ± 0.21%), and Amiloride-treated group (12.37% ± 0.83%) relative to controls, indicating that caveolae-dependent endocytosis was the predominant route for LBPNS-BSA-FITC, with macropinocytosis also involved (Figure 3g).
The differential internalization pathways of LBPNS-BSA-FITC and SBPNS-BSA-FITC were attributed to their distinct sizes. Specifically, the smaller SBPNS-BSA-FITC nanoparticles were found to be more prone to aggregation, which facilitated their uptake predominantly via micropinocytosis (>200 nm) [17,44]. In contrast, the larger LBPNS-BSA-FITC nanoparticles, with a size approaching 60 nm, were primarily internalized through caveolae-dependent endocytosis (60–80 nm) [45,46]. This observation was consistent with studies on gold nanoparticles. For instance, Brandenberger et al. [47] reported that conventional gold nanoparticles were taken up through various mechanisms, including macropinocytosis, clathrin-dependent endocytosis, and caveolae-dependent endocytosis, influenced by factors such as surface charge and particle size. Conversely, PEG-coated gold nanoparticles were predominantly internalized via clathrin-dependent endocytosis or caveolae-dependent endocytosis, with minimal involvement of micropinocytosis. Additionally, Chen et al. [48] examined the uptake of BP-DOX in 4T1 cells using DOX fluorescence and demonstrated that the cellular uptake of BP-DOX was energy-dependent. Treatment with amiloride substantially decreased intracellular fluorescence intensity, indicating that macropinocytosis was the primary pathway for BP-DOX internalization, similar to the uptake mechanism observed for SBPNS-BSA-FITC. Furthermore, Zhao et al. [43] utilized surface-enhanced Raman spectroscopy to investigate the internalization pathways of BP-Au NSs in HepG2 cells. Their results suggested that BP-Au NSs primarily entered cells via macropinocytosis and caveolae-dependent endocytosis, mirroring the internalization pathways observed for BPNS-BSA-FITC.
In summary, BPNS was internalized by cells predominantly via phagocytosis, with peak uptake being observed approximately 10 h post-exposure. The cellular uptake of BPNS was positively correlated with its concentration. Especially, SBPNS was more readily internalized by cells compared to LBPNS. This difference was influenced by the size of the BPNS, with SBPNS being primarily internalized through macropinocytosis, whereas LBPNS was mainly taken up via caveolae-dependent endocytosis.
Distribution of SBPNS and LBPNS in cells
TEM was employed to examine cells that had been exposed to BPNS-BSA-FITC. Given that BPNS-BSA-FITC predominantly contained phosphorus, measurements of phosphorus content were conducted at various locations. It was noted that phosphorus levels in regions marked by black dots significantly exceeded those in the blank and cell membrane, indicating the accumulation of BPNS-BSA-FITC in these areas (Figure S7a and b in the Supporting information). TEM images confirmed that BPNS-BSA-FITC was predominantly localized within lysosomes, with additional localization observed in the Golgi apparatus and mitochondria (Figure 4a). In contrast, minimal levels of BPNS-BSA-FITC were detected in the endoplasmic reticulum and cell nucleus (Figure S8 in the Supporting information).
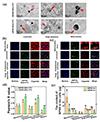 |
Figure 4 Distribution of SBPNS and LBPNS in cells. (a) TEM images of SBPNS-BSA-FITC and LBPNS-BSA-FITC in organelles such as Lysosome, Golgi apparatus, and Mitochondria. (b) Fluorescence confocal photographs of LBPNS-BSA-FITC in different organelles of A549 cells after 12 h of LBPNS-BSA-FITC exposure (green: LBPNS-BSA-FITC; blue: Nucleus; red: Endoplasmic Reticulum, Golgi apparatus, Mitochondrion, and Lysosome). (c) Fluorescence confocal photographs of SBPNS-BSA-FITC in different organelles of A549 cells after 12 h of SBPNS-BSA-FITC exposure (green: SBPNS-BSA-FITC; blue: Nucleus; red: Endoplasmic Reticulum, Golgi apparatus, Mitochondrion, and Lysosome). (d) Pearson’s co-localization coefficients of LBPNS-BSA-FITC or SBPNS-BSA-FITC with different organelles (n = 3). (e) LBPNS or SBPNS content in different organelles in BPNS-Au exposed cells (n = 3). |
To gain a deeper understanding of the intracellular distribution of internalized BPNS-BSA-FITC across various organelles, fluorescence confocal microscopy was employed to capture images of BPNS-BSA-FITC in conjunction with different cellular components. As illustrated in Figure 4b, a distinct yellow fluorescence overlap was observed between LBPNS-BSA-FITC and lysosomes, the Golgi apparatus, and mitochondria in A549 cells. Similar results were obtained in A549 cells exposed to SBPNS-BSA-FITC (Figure 4c).
To accurately assess the distribution of SBPNS-BSA-FITC and LBPNS-BSA-FITC within cells, colocalization analysis of fluorescence confocal images was performed. As illustrated in Figure 4d, the extent of overlap between the green fluorescence of BPNS-BSA-FITC and the fluorescence of specific organelles was quantified by Pearson’s colocalization coefficients. High Pearson’s colocalization coefficients were observed for LBPNS-BSA-FITC with lysosomes and the Golgi apparatus, significantly surpassing those observed with mitochondria (P < 0.05). This indicated that LBPNS-BSA-FITC was primarily localized within lysosomes and the Golgi apparatus, with a secondary localization in mitochondria, a phenomenon also observed for cells exposed to SBPNS-BSA-FITC. The findings supported the conclusion that SBPNS predominantly underwent internalization via macropinocytosis, while LBPNS primarily utilized caveolae-dependent endocytosis. The presence of BPNS-BSA-FITC in mitochondria was attributed to its escape from lysosomes into the cytoplasm, subsequently accessing other organelles such as mitochondria [30,43]. Pearson’s colocalization coefficients showed that LBPNS-BSA-FITC exhibited significantly higher colocalization with lysosomes and the Golgi apparatus compared to SBPNS-BSA-FITC (P < 0.05), likely due to the larger size of LBPNS, which facilitated stronger fluorescence overlap with cellular organelles. However, no significant difference in Pearson’s colocalization coefficients was found between LBPNS-BSA-FITC and SBPNS-BSA-FITC within mitochondria (P > 0.05), further supporting the notion that BPNS entering mitochondria might have escaped from lysosomes.
The subcellular distribution of BPNS was further quantitatively analyzed using a gold nanoparticle labeling method. Gold nanoparticles were uniformly loaded onto the irregular BPNS surfaces, with gold nanoparticle loading capacities of 19.43 ± 0.82 μg/mg for SBPNS and 20.16 ± 1.13 μg/mg for LBPNS (Figure S9a–e in the Supporting information). In a cellular exposure system containing 1.5 × 10⁷ cells, gold element-based quantitative analysis revealed that SBPNS were predominantly localized in mitochondria (37.20 ± 7.10 μg), followed by the Golgi apparatus (7.65 ± 1.20 μg) and lysosomes (4.17 ± 0.69 μg) (Figure 4e). This distribution pattern was consistent with that observed for LBPNS. Particularly, the preferential mitochondrial distribution of SBPNS-Au differed from the predominant lysosomal localization of SBPNS-BSA-FITC, which was attributed to distinct labeling strategies. BPNS-Au surface is modified by gold nanoparticles, and its surface charge, hydrophobicity, and interaction with cell components may be different from BPNS-BSA-FITC [49]. Additionally, 6.73 ± 0.42 μg of SBPNS was detected in nuclear samples, likely due to cross-contamination resulting from incomplete separation of plasma membrane fragments from nuclear components during centrifugal isolation.
It has been highlighted in prior research that the size effect significantly affected the internalization of BPNS by cells, with various endocytic pathways directing substances to distinct cellular compartments. For example, materials were delivered to late endosomes or lysosomes via macropinosomes through phagocytosis; early endosomes were generated by clathrin-dependent endocytosis and were matured into late endosomes through fusion with lysosomes; and vesicular structures were formed by caveolae-dependent endocytosis, transferring contents to the smooth endoplasmic reticulum or Golgi apparatus [50–53]. BPNS were internalized through both macropinocytosis and caveolae-dependent endocytosis, with distribution observed across various organelles, including lysosomes, the Golgi apparatus, and mitochondria. Despite the differing primary uptake mechanisms of LBPNS and SBPNS, their intracellular distribution patterns were found to be comparable.
Effects of BPNS on mitochondria functions and metabolomics
Based on previous research, it was established that BPNS entered the intracellular environment and was transported to the mitochondria. Consequently, the effects of BPNS on mitochondrial functions and cellular metabolism were deemed essential to research. To further explore the impact of BPNS on mitochondrial function, indicators such as Ca2+ concentration, mitochondrial membrane potential, cell cycle, and ROS were examined.
Ca2+ was known to play crucial roles in the mitochondrial TCA cycle and intracellular signaling. Ca2+ was demonstrated to affect the process of apoptosis as well. When cells were exposed to LBPNS, a decrease in intracellular Ca2+ levels was observed. It was noteworthy that LBPNS induced a concentration-dependent decrease in intracellular Ca2+ levels, which decreased by approximately 30% when the cellular exposure to BPNS increased from 1.25 to 10 μg/mL (Figure 5a). This phenomenon was attributed to the potential adsorption of Ca2+ onto the surface of BPNS (0.02 mg/mL, 200 nm), which could interfere with cell balance and mitochondrial function, and even induce oxidative stress and cell apoptosis [54,55]. Furthermore, biomineralization was also a potential mechanism. Ca2+ could engage in biomineralization reactions with phosphate resulting from oxidation on BPNS, progressing through nucleation, crystal growth, and self-assembly stages [56].
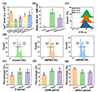 |
Figure 5 Effects of BPNS on mitochondria functions. (a) Effects of different concentrations of LBPNS on intracellular Ca2+ level (n = 3). (b) Effects of different concentrations of LBPNS on mitochondrial membrane potential (MMP) (Due to low mitochondrial membrane potential, green fluorescence was exhibited by JC-10 at 525 nm. Due to high mitochondrial membrane potential, red fluorescence was exhibited by JC-10 at 590 nm) (n = 3). (c) Effects of SBPNS and LBPNS(5 μg/mL)on intracellular ROS level (n = 3). (d) Detection of the effects of LBPNS and SBPNS on the cell cycle by flow cytometry. (e) Effect of LBPNS and SBPNS on the cell S phase. (f) Effect of LBPNS and SBPNS on the cell G2/M phase. (g) Effect of LBPNS and SBPNS on the cell G0/G1 phase. |
The mitochondrial membrane potential, essential for oxidative phosphorylation and ATP production, was measured by JC-10. The experimental data revealed that LBPNS induced a decrease in mitochondrial membrane potential, with more significant decreases observed at higher LBPNS concentrations (Figure 5b). Similar results were noted in cells treated with SBPNS (Figure S10a in the Supporting information). Fluorescence microscopy of these cells demonstrated that compared to cells treated with 5 μg/mL LBPNS, cells treated with 10 μg/mL LBPNS exhibited increased green fluorescence and decreased red fluorescence. A similar trend was observed in cells treated with SBPNS, consistent with the experimental findings (Figure S10b in the Supporting information). Previous studies have shown that abnormalities in mitochondrial membrane potential could also be caused by the calcium phosphate mineralization of black phosphorus, which was consistent with our results [57]. Given that abnormalities in mitochondrial membrane potential were early indicators of cell apoptosis, it was hypothesized that LBPNS might induce cell apoptosis [58].
Additionally, flow cytometry was employed to measure intracellular ROS levels and cell cycle. Our results showed that exposure to 5 μg/mL of SBPNS or LBPNS significantly increased the intracellular ROS levels (Figure 5c and Table S1 in the Supporting information), which was attributed to the formation of Ca3(PO4)2 through the binding of phosphates with Ca2+, leading to cellular stress and elevated ROS levels [59]. The cell cycle refers to the complete process from the end of one division to the end of the next and is divided into four phases. During the G1 phase, proteins, RNA, and other substances are synthesized to prepare for DNA replication. Cells unsuitable for division enter a quiescent state (G0 phase). In the S phase, DNA replication is completed, leading to chromosome doubling. The G2 phase involves the synthesis of proteins required for mitosis, preparing the cell for division. Finally, the M phase executes mitosis and cytokinesis. Experimental results demonstrated that BPNS induced cell cycle arrest in the S and G2/M phases while shortening the G0/G1 phase, as shown in Figure 5d–g. Specifically, SBPNS increased the proportion of cells in the S phase from 11.77% ± 1.40% to 15.23% ± 2.76%, and the G2/M phase proportion increased from 19.83% ± 0.91% to 27.90% ± 1.76%, while the G0/G1 phase proportion decreased from 64.67% ± 0.60% to 51.07% ± 4.18%. Moreover, no significant differences were observed between SBPNS and LBPNS in their effects on the cell cycle. Cell cycle arrest in the S and G2/M phases may lead to abnormal DNA replication or chromosome missegregation, ultimately resulting in apoptosis or cell death. Similar phenomena have also been observed in HeLa and MCF-7 cells [60]. Gen used the G2/M arrest capability of black phosphorus (2.60 nm) in conjunction with gemcitabine (GEM) to trigger apoptosis in pancreatic cancer cells, leading to a synergistic inhibition of tumor growth. For example, after 21 d of treatment, tumor inhibition was 4.4 folds higher in the combination group than in the BP@NPs (1.5 mg/kg) group and 5.4 folds higher than in the GEM@NPs (10 mg/kg) group [61]. This phenomenon was attributed to the inactivation of centrosomal kinase PLK1 by BPNS (4 μg/mL, 250 nm), leading to the disruption of mitotic centrosomes. This disruption resulted in the formation of multipolar spindles, ultimately causing a delay in mitosis [62].
To investigate the impact of LBPNS on cellular metabolism, LC-QTOF-MS was employed to analyze 113 different metabolites. Significant alterations in cellular metabolism induced by LBPNS compared to the CK group were revealed through metabolomic visualization analysis. The SPLS-DA model diagram for different groups showed that Metabolite Component 1 and Metabolite Component 2 accounted for 13.2% and 43.2% of the total variance, respectively, with clear separation between groups (Figure 6a). A volcano plot of differential metabolites presented in Figure 6b indicated that purple dots on the left represented downregulated metabolites, while red dots on the right represented upregulated metabolites. Compared to the CK group, a decrease in 7 metabolites and an increase in 6 metabolites were observed with LBPNS treatment. Figure 6c provided a heatmap of the top 25 metabolites ranked by VIP values, highlighting significant disturbances in the metabolite profile caused by LBPNS treatment. Disturbances were noted in purines (such as Hypoxanthine), amino acids (such as L-Cystine), and dipeptides (such as Ile-Cys and His-Met), among others. Metabolic pathway analysis of these differential metabolites indicated that several cellular metabolic pathways were affected by LBPNS treatment, including Pyrimidine metabolism, Pyruvate metabolism, Purine metabolism, and Linoleic acid metabolism (Figure 6d). The significant impact of LBPNS on cellular metabolism was emphasized by these findings.
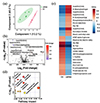 |
Figure 6 Effects of BPNS on metabolomics. (a) SPLS-DA model diagram of different treatments. (b) Volcano plot of metabolomics. (c) Heat maps of metabolic differential substances (VIP top 25). (d) Metabolic pathway maps of metabolic differential substances (VIP > 1). |
In summary, the cellular uptake of BPNS resulted in a decreased mitochondrial Ca2+ level, reduced mitochondrial membrane potential, increased ROS levels, cell cycle arrest in the S and G2/M phases, and significant disturbances in cellular metabolism, such as abnormalities in Pyruvate metabolism.
CONCLUSION
When BPNS were introduced into the human body as medical materials, the understanding of their intracellular behavior and impact on cellular functions was deemed crucial. Fluorescently labeled BPNS of two different sizes were utilized to investigate their uptake mechanisms and distribution within cells. The effects of BPNS on mitochondrial function and cellular metabolism were concentrated upon in the research. The size of BPNS was found to influence their uptake and accumulation, with smaller nanosheets being internalized more readily. This highlighted the importance of considering nanomaterial size in cellular effect studies. Although similar distribution patterns within cells were exhibited by both sizes, their presence in mitochondria indicated potential impacts on mitochondrial function. It was demonstrated that BPNS entering cells generated ROS, which led to decreased mitochondrial membrane potential, reduced Ca2+ concentration, cell cycle arrest in the S phase and G2/M phase, and disruption of cellular metabolism. This study focuses on the cellular processes of black phosphorus nanosheets and their effects on cell function, deepens people’s understanding of nanomaterial-biological interface interactions, provides a basis for biosafety assessment of black phosphorus nanosheets, and contributes to the development of drug delivery systems and diagnostic platforms based on black phosphorus nanosheets.
Data availability
The original data are available from corresponding authors upon reasonable request.
Funding
This work was supported by the National Natural Science Foundation of China (22206087, 22125602 and 22341601) and the National Key R&D Program of China (2022YFC3701402).
Author contributions
Y.X. contributed to writing the original draft, methodology, investigation, and data curation; Z.Z. contributed to methodology and data curation; X.S. contributed to investigation; K.L. contributed to data curation; S.D. contributed to data curation; Q.K. contributed to investigation; B.H. contributed to methodology; P.X. contributed to investigation; L.Z. contributed to methodology; Z.Y. contributed to methodology and funding acquisition; L.M. contributed to writing review and editing, supervision, project administration, and funding acquisition.
Conflict of interest
The authors declare no conflict of interest.
Supplementary information
Supplementary file provided by the authors. Access Supplementary Material
References
- Ling X, Wang H, Huang S, et al. The renaissance of black phosphorus. Proc Natl Acad Sci USA 2015; 112: 4523-4530. [Article] [Google Scholar]
- Li X, Yu Z, Xiong X, et al. High-speed black phosphorus field-effect transistors approaching ballistic limit. Sci Adv 2019; 5: eaau3194. [Article] [Google Scholar]
- Sun Z, Xie H, Tang S, et al. Ultrasmall black phosphorus quantum dots: Synthesis and use as photothermal agents. Angew Chem Int Ed 2015; 54: 11526-11530. [Article] [Google Scholar]
- Zhou Q, Chen Q, Tong Y, et al. Light-induced ambient degradation of few-layer black phosphorus: Mechanism and protection. Angew Chem Int Ed 2016; 55: 11437-11441. [Article] [CrossRef] [PubMed] [Google Scholar]
- Luo ZC, Liu M, Guo ZN, et al. Microfiber-based few-layer black phosphorus saturable absorber for ultra-fast fiber laser. Opt Express 2015; 23: 20030. [Article] [Google Scholar]
- Tao W, Zhu X, Yu X, et al. Black phosphorus nanosheets as a robust delivery platform for cancer theranostics. Adv Mater 2017; 29: 1603276. [Article] [Google Scholar]
- Xu Y, Ren F, Liu H, et al. Cholesterol-modified black phosphorus nanospheres for the first NIR-II fluorescence bioimaging. ACS Appl Mater Interfaces 2019; 11: 21399-21407. [Article] [Google Scholar]
- Srivastava A, Verma A, Das R, et al. A theoretical approach to improve the performance of SPR biosensor using MXene and black phosphorus. Optik 2020; 203: 163430. [Article] [Google Scholar]
- Chen T, Zeng W, Tie C, et al. Engineered gold/black phosphorus nanoplatforms with remodeling tumor microenvironment for sonoactivated catalytic tumor theranostics. Bioact Mater 2022; 10: 515-525. [Article] [Google Scholar]
- Shao J, Xie H, Huang H, et al. Biodegradable black phosphorus-based nanospheres for in vivo photothermal cancer therapy. Nat Commun 2016; 7: 12967. [Article] [Google Scholar]
- Zeng X, Luo M, Liu G, et al. Polydopamine‐modified black phosphorous nanocapsule with enhanced stability and photothermal performance for tumor multimodal treatments. Adv Sci 2018; 5: 1800510. [Article] [Google Scholar]
- Sun C, Wen L, Zeng J, et al. One-pot solventless preparation of PEGylated black phosphorus nanoparticles for photoacoustic imaging and photothermal therapy of cancer. Biomaterials 2016; 91: 81-89. [Article] [Google Scholar]
- Kumar V, Brent JR, Shorie M, et al. Nanostructured aptamer-functionalized black phosphorus sensing platform for label-free detection of myoglobin, a cardiovascular disease biomarker. ACS Appl Mater Interfaces 2016; 8: 22860-22868. [Article] [Google Scholar]
- Zeng J, Ruan F, Wu M, et al. Black phosphorus quantum dots cause glucose metabolism disorder and insulin resistance in mice. Ecotoxicol Environ Saf 2022; 246: 114168. [Article] [Google Scholar]
- You R, Mu Y, Zhou J, et al. Ferroptosis is involved in trophoblast cells cytotoxicity induced by black phosphorus nanoparticles. Toxicology 2024; 505: 153810. [Article] [Google Scholar]
- Mohamad Latiff N, Mayorga-Martinez CC, Sofer Z, et al. Cytotoxicity of phosphorus allotropes (black, violet, red). Appl Mater Today 2018; 13: 310-319. [Article] [Google Scholar]
- Dolai J, Mandal K, Jana NR. Nanoparticle size effects in biomedical applications. ACS Appl Nano Mater 2021; 4: 6471-6496. [Article] [Google Scholar]
- Xia T, Kovochich M, Liong M, et al. Cationic polystyrene nanosphere toxicity depends on cell-specific endocytic and mitochondrial injury pathways. ACS Nano 2008; 2: 85-96. [Article] [Google Scholar]
- Linares J, Matesanz MC, Vila M, et al. Endocytic mechanisms of graphene oxide nanosheets in osteoblasts, hepatocytes and macrophages. ACS Appl Mater Interfaces 2014; 6: 13697-13706. [Article] [Google Scholar]
- Li Y, Lu Z, Li Z, et al. Cellular uptake and distribution of graphene oxide coated with layer-by-layer assembled polyelectrolytes. J Nanopart Res 2014; 16: 2384. [Article] [Google Scholar]
- Ambrosi A, Sofer Z, Pumera M. Electrochemical exfoliation of layered black phosphorus into phosphorene. Angew Chem Int Ed 2017; 56: 10443-10445. [Article] [Google Scholar]
- Zhao W, Xue Z, Wang J, et al. Large-scale, highly efficient, and green liquid-exfoliation of black phosphorus in ionic liquids. ACS Appl Mater Interfaces 2015; 7: 27608-27612. [Article] [Google Scholar]
- Augustine R, Hasan A, Primavera R, et al. Cellular uptake and retention of nanoparticles: Insights on particle properties and interaction with cellular components. Mater Today Commun 2020; 25: 101692. [Article] [Google Scholar]
- Bai X, Wang S, Yan X, et al. Regulation of cell uptake and cytotoxicity by nanoparticle core under the controlled shape, size, and surface chemistries. ACS Nano 2020; 14: 289-302. [Article] [Google Scholar]
- Mu Q, Su G, Li L, et al. Size-dependent cell uptake of protein-coated graphene oxide nanosheets. ACS Appl Mater Interfaces 2012; 4: 2259-2266. [Article] [Google Scholar]
- He C, Hu Y, Yin L, et al. Effects of particle size and surface charge on cellular uptake and biodistribution of polymeric nanoparticles. Biomaterials 2010; 31: 3657-3666. [Article] [Google Scholar]
- Kästner C, Böhmert L, Braeuning A, et al. Fate of fluorescence labels—Their adsorption and desorption kinetics to silver nanoparticles. Langmuir 2018; 34: 7153-7160. [Article] [Google Scholar]
- Katsikari A, Patronidou C, Kiparissides C, et al. Uptake and cytotoxicity of poly(D,L-lactide-co-glycolide) nanoparticles in human colon adenocarcinoma cells. Mater Sci Eng-B 2009; 165: 160-164. [Article] [Google Scholar]
- Chaikhumwang P, Kitsongsermthon J, Manopakdee K, et al. Cationic polylactic acid-based nanoparticles improve BSA-FITC transport across M cells and engulfment by porcine alveolar macrophages. AAPS PharmSciTech 2020; 21: 134. [Article] [Google Scholar]
- Mo J, Xie Q, Wei W, et al. Revealing the immune perturbation of black phosphorus nanomaterials to macrophages by understanding the protein corona. Nat Commun 2018; 9: 2480. [Article] [NASA ADS] [CrossRef] [PubMed] [Google Scholar]
- Lim Y, Zhou W, Li G, et al. Black phosphorus nanomaterials regulate the aggregation of amyloid-β. ChemNanoMat 2019; 5: 606-611. [Article] [Google Scholar]
- Xiao Q, Tu X, Cao H, et al. Interaction thermodynamics investigation of bovine serum albumin with black phosphorus quantum dots via spectroscopic and molecular simulation techniques. J Mol Struct 2023; 1276: 134725. [Article] [Google Scholar]
- Huang S, Yang E, Liu Y, et al. Low-temperature rapid synthesis of nitrogen and phosphorus dual-doped carbon dots for multicolor cellular imaging and hemoglobin probing in human blood. Sens Actuat B-Chem 2018; 265: 326-334. [Article] [Google Scholar]
- Zhou Y, Yu M, Liang H, et al. Novel dual-effective Z-scheme heterojunction with g-C3N4, Ti3C2 MXene and black phosphorus for improving visible light-induced degradation of ciprofloxacin. Appl Catal B-Environ 2021; 291: 120105. [Article] [Google Scholar]
- Fukushima K, Yonezawa M, Rengakuji S, et al. Pyrolysis of triphenyl (diphenoxyphosphinyl)phosphorimidate. J Anal Appl Pyrolysis 1998; 45: 41-58. [Article] [Google Scholar]
- Lu Y, Lu Y, Yang Y, et al. Synthesis and application of a novel high durable cotton flame retardant rich in PN covalent bonds and ammonium phosphate groups. Chem Eng J 2023; 454: 140422. [Article] [Google Scholar]
- Thurakkal S, Zhang X. Covalent functionalization of two-dimensional black phosphorus nanosheets with porphyrins and their photophysical characterization. Mater Chem Front 2021; 5: 2824-2831. [Article] [Google Scholar]
- Liu X, Liu Y, Wang Y, et al. High electrosorption capacity of uranium (VI) by carboxylic acid functionaliszed N,P Co-doped carbon materials. J Electrochem Soc 2021; 168: 066514. [Article] [Google Scholar]
- Kiliaris P, Papaspyrides CD. Polymer/layered silicate (clay) nanocomposites: An overview of flame retardancy. Prog Polym Sci 2010; 35: 902-958. [Article] [Google Scholar]
- Ribeiro HB, Pimenta MA, de Matos CJS. Raman spectroscopy in black phosphorus. J Raman Spectr 2018; 49: 76-90. [Article] [Google Scholar]
- Lord MS, Foss M, Besenbacher F. Influence of nanoscale surface topography on protein adsorption and cellular response. Nano Today 2010; 5: 66-78. [Article] [Google Scholar]
- Ma X, Sun R, Cheng J, et al. Fluorescence aggregation-caused quenching versus aggregation-induced emission: A visual teaching technology for undergraduate chemistry students. J Chem Educ 2016; 93: 345-350. [Article] [Google Scholar]
- Zhao H, Zhang W, Liu Z, et al. Insights into the intracellular behaviors of black-phosphorus-based nanocomposites via surface-enhanced Raman spectroscopy. Nanophotonics 2018; 7: 1651-1662. [Article] [Google Scholar]
- da Cruz Schneid A, Albuquerque LJC, Mondo GB, et al. Colloidal stability and degradability of silica nanoparticles in biological fluids: A review. J Sol-Gel Sci Technol 2022; 102: 41-62. [Article] [Google Scholar]
- Zhao F, Zhao Y, Liu Y, et al. Cellular uptake, intracellular trafficking, and cytotoxicity of nanomaterials. Small 2011; 7: 1322-1337. [Article] [Google Scholar]
- Vikesland PJ, Rebodos RL, Bottero JY, et al. Aggregation and sedimentation of magnetite nanoparticle clusters. Environ Sci-Nano 2016; 3: 567-577. [Article] [Google Scholar]
- Brandenberger C, Mühlfeld C, Ali Z, et al. Quantitative evaluation of cellular uptake and trafficking of plain and polyethylene glycol-coated gold nanoparticles. Small 2010; 6: 1669-1678. [Article] [Google Scholar]
- Chen W, Ouyang J, Liu H, et al. Black phosphorus nanosheet-based drug delivery system for synergistic photodynamic/photothermal/chemotherapy of cancer. Adv Mater 2017; 29: 1603864. [Article] [Google Scholar]
- Zhang J, Mou L, Jiang X. Surface chemistry of gold nanoparticles for health-related applications. Chem Sci 2020; 11: 923-936. [Article] [Google Scholar]
- McMahon HT, Boucrot E. Molecular mechanism and physiological functions of clathrin-mediated endocytosis. Nat Rev Mol Cell Biol 2011; 12: 517-533. [Article] [Google Scholar]
- Popova NV, Deyev IE, Petrenko AG. Clathrin-mediated endocytosis and adaptor proteins. Acta Naturae 2013; 5: 62-73. [Article] [Google Scholar]
- Pelkmans L, Bürli T, Zerial M, et al. Caveolin-stabilized membrane domains as multifunctional transport and sorting devices in endocytic membrane traffic. Cell 2004; 118: 767-780. [Article] [Google Scholar]
- Manzanares D, Ceña V. Endocytosis: The nanoparticle and submicron nanocompounds gateway into the cell. Pharmaceutics 2020; 12: 371. [Article] [Google Scholar]
- Chen W, Ouyang J, Yi X, et al. Black phosphorus nanosheets as a neuroprotective nanomedicine for neurodegenerative disorder therapy. Adv Mater 2018; 30: 1703458. [Article] [Google Scholar]
- Chang M, Zhang L, Zhang T, et al. Ultrasound-augmented enzyodynamic-Ca2+ overload synergetic tumor nanotherapy. Biomaterials 2024; 307: 122513. [Article] [Google Scholar]
- Shao J, Ruan C, Xie H, et al. Photochemical activity of black phosphorus for near-infrared light controlled in situ biomineralization. Adv Sci 2020; 7: 2000439. [Article] [Google Scholar]
- Pan T, Fu W, Xin H, et al. Calcium phosphate mineralized black phosphorous with enhanced functionality and anticancer bioactivity. Adv Funct Mater 2020; 30: 2003069. [Article] [Google Scholar]
- Zhao X, Ma X, Wu G, et al. Black phosphorus nanosheets induce apoptosis of triple-negative breast cancer cells mediated by mitochondrial apoptosis pathway. Chin J Front Med Sci (Electron Version) 2023; 15: 25–32 [Google Scholar]
- Xiao Y, Li Z, Bianco A, et al. Recent advances in calcium-based anticancer nanomaterials exploiting calcium overload to trigger cell apoptosis. Adv Funct Mater 2023; 33: 2209291. [Article] [Google Scholar]
- Zhou W, Pan T, Cui H, et al. Black phosphorus: Bioactive nanomaterials with inherent and selective chemotherapeutic effects. Angew Chem Int Ed 2019; 58: 769-774. [Article] [Google Scholar]
- Geng S, Zhang X, Luo T, et al. Combined chemotherapy based on bioactive black phosphorus for pancreatic cancer therapy. J Control Release 2023; 354: 889-901. [Article] [Google Scholar]
- Shao X, Ding Z, Zhou W, et al. Intrinsic bioactivity of black phosphorus nanomaterials on mitotic centrosome destabilization through suppression of PLK1 kinase. Nat Nanotechnol 2021; 16: 1150-1160. [Article] [NASA ADS] [CrossRef] [MathSciNet] [Google Scholar]
All Figures
|
Figure 1 Preparation of BPNS. (a) Representative AFM morphology of SBPNS. (b) Thickness of SBPNS (n = 3). (c) Histogram of SBPNS size distribution. (d) Representative AFM morphology of LBPNS. (e) Thicknesses of LBPNS (n = 3). (f) Histogram of LBPNS size distribution. Histograms were developed by counting each sample (200–300) with shown Gaussian fitted curves. |
| In the text | |
|
Figure 2 Characterization of BPNS and BPNS-BSA-FITC. (a) Fluorescence spectra of BPNS and BPNS-BSA-FITC (EX = 490 nm). (b) N1s spectra of BPNS-BSA-FITC samples characterized by XPS. (c) P2p spectra of BPNS-BSA-FITC samples characterized by XPS. (d) Raman spectra of BPNS and BPNS-BSA-FITC. (e) Fluorescence intensity of SBPNS-BSA-FITC and LBPNS-BSA-FITC (Ex = 490 nm, Em = 520 nm, n = 3). (f) Zeta potential of BPNS and BPNS-BSA-FITC in different environments (n = 3). |
| In the text | |
|
Figure 3 Uptake of LBPNS and SBPNS by cells. (a) Fluorescence confocal pictures of SBPNS-BSA-FITC and LBPNS-BSA-FITC inside the cell membrane. (b–d) Percentage of FITC-positive cells to total cell number in SBPNS-BSA-FITC and LBPNS-BSA-FITC (2.5, 5.0, and 10.0 μg/mL) exposed cells detected by flow cytometry (n = 3). (e) Percentage of FITC-positive cells to total cell number exposed to different concentrations of SBPNS-BSA-FITC and LBPNS-BSA-FITC for 34 h detected by flow cytometry (n = 3). (f) Percentage of FITC-positive cells to total cell number in different inhibitor-treated groups after 12 h exposure to 10 μg/mL SBPNS-BSA-FITC (n = 3). (g) Percentage of FITC-positive cells to total cell number in different inhibitor-treated groups after 12 h exposure to 10 μg/mL LBPNS-BSA-FITC (n = 3). |
| In the text | |
|
Figure 4 Distribution of SBPNS and LBPNS in cells. (a) TEM images of SBPNS-BSA-FITC and LBPNS-BSA-FITC in organelles such as Lysosome, Golgi apparatus, and Mitochondria. (b) Fluorescence confocal photographs of LBPNS-BSA-FITC in different organelles of A549 cells after 12 h of LBPNS-BSA-FITC exposure (green: LBPNS-BSA-FITC; blue: Nucleus; red: Endoplasmic Reticulum, Golgi apparatus, Mitochondrion, and Lysosome). (c) Fluorescence confocal photographs of SBPNS-BSA-FITC in different organelles of A549 cells after 12 h of SBPNS-BSA-FITC exposure (green: SBPNS-BSA-FITC; blue: Nucleus; red: Endoplasmic Reticulum, Golgi apparatus, Mitochondrion, and Lysosome). (d) Pearson’s co-localization coefficients of LBPNS-BSA-FITC or SBPNS-BSA-FITC with different organelles (n = 3). (e) LBPNS or SBPNS content in different organelles in BPNS-Au exposed cells (n = 3). |
| In the text | |
|
Figure 5 Effects of BPNS on mitochondria functions. (a) Effects of different concentrations of LBPNS on intracellular Ca2+ level (n = 3). (b) Effects of different concentrations of LBPNS on mitochondrial membrane potential (MMP) (Due to low mitochondrial membrane potential, green fluorescence was exhibited by JC-10 at 525 nm. Due to high mitochondrial membrane potential, red fluorescence was exhibited by JC-10 at 590 nm) (n = 3). (c) Effects of SBPNS and LBPNS(5 μg/mL)on intracellular ROS level (n = 3). (d) Detection of the effects of LBPNS and SBPNS on the cell cycle by flow cytometry. (e) Effect of LBPNS and SBPNS on the cell S phase. (f) Effect of LBPNS and SBPNS on the cell G2/M phase. (g) Effect of LBPNS and SBPNS on the cell G0/G1 phase. |
| In the text | |
|
Figure 6 Effects of BPNS on metabolomics. (a) SPLS-DA model diagram of different treatments. (b) Volcano plot of metabolomics. (c) Heat maps of metabolic differential substances (VIP top 25). (d) Metabolic pathway maps of metabolic differential substances (VIP > 1). |
| In the text | |
Current usage metrics show cumulative count of Article Views (full-text article views including HTML views, PDF and ePub downloads, according to the available data) and Abstracts Views on Vision4Press platform.
Data correspond to usage on the plateform after 2015. The current usage metrics is available 48-96 hours after online publication and is updated daily on week days.
Initial download of the metrics may take a while.