Figure 5
Download original image
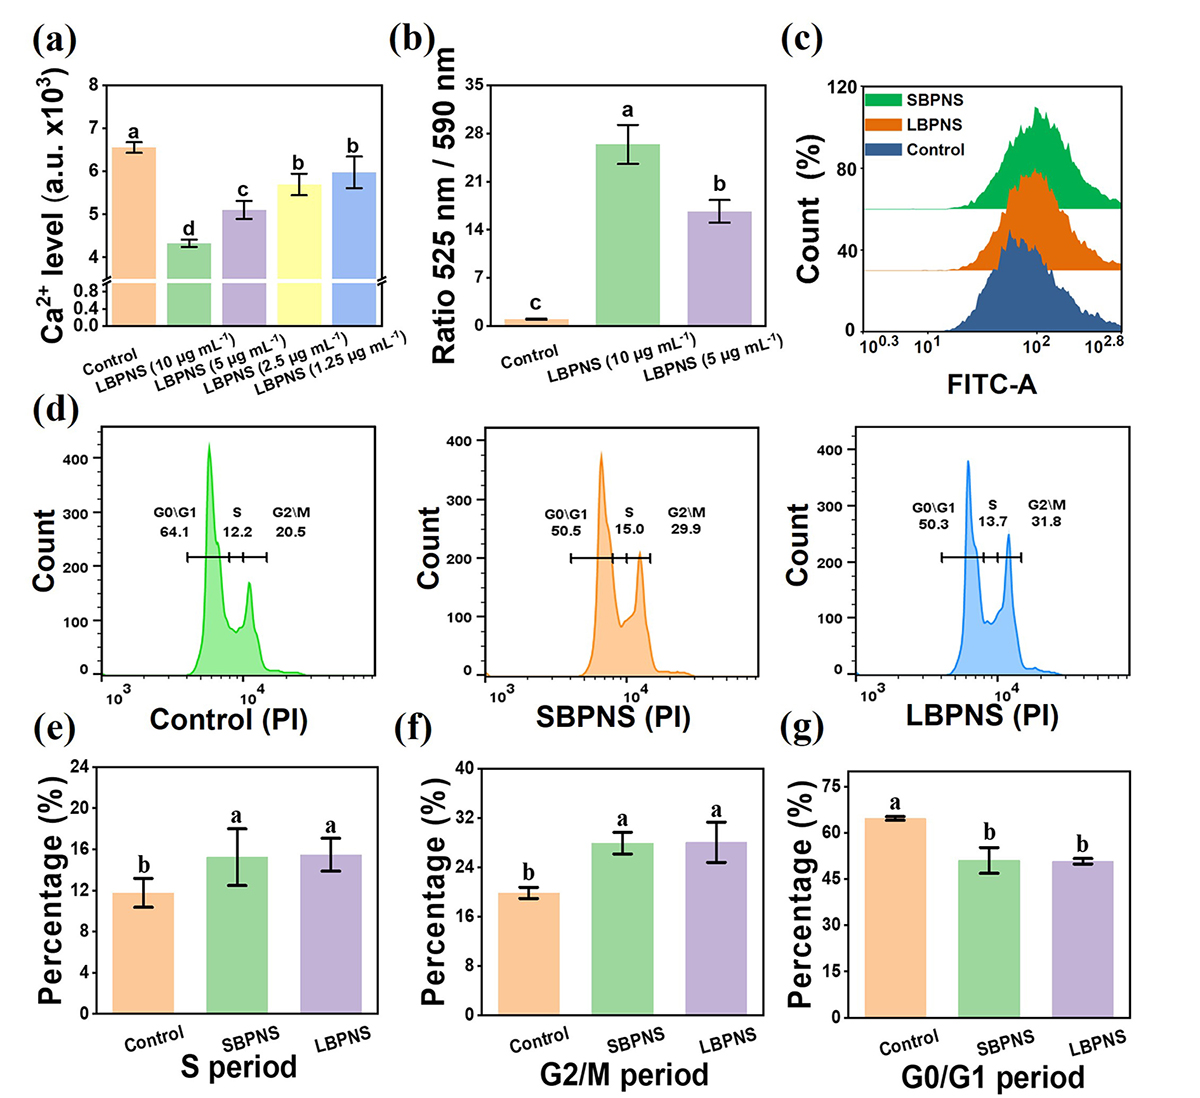
Effects of BPNS on mitochondria functions. (a) Effects of different concentrations of LBPNS on intracellular Ca2+ level (n = 3). (b) Effects of different concentrations of LBPNS on mitochondrial membrane potential (MMP) (Due to low mitochondrial membrane potential, green fluorescence was exhibited by JC-10 at 525 nm. Due to high mitochondrial membrane potential, red fluorescence was exhibited by JC-10 at 590 nm) (n = 3). (c) Effects of SBPNS and LBPNS(5 μg/mL)on intracellular ROS level (n = 3). (d) Detection of the effects of LBPNS and SBPNS on the cell cycle by flow cytometry. (e) Effect of LBPNS and SBPNS on the cell S phase. (f) Effect of LBPNS and SBPNS on the cell G2/M phase. (g) Effect of LBPNS and SBPNS on the cell G0/G1 phase.
Current usage metrics show cumulative count of Article Views (full-text article views including HTML views, PDF and ePub downloads, according to the available data) and Abstracts Views on Vision4Press platform.
Data correspond to usage on the plateform after 2015. The current usage metrics is available 48-96 hours after online publication and is updated daily on week days.
Initial download of the metrics may take a while.