Figure 4
Download original image
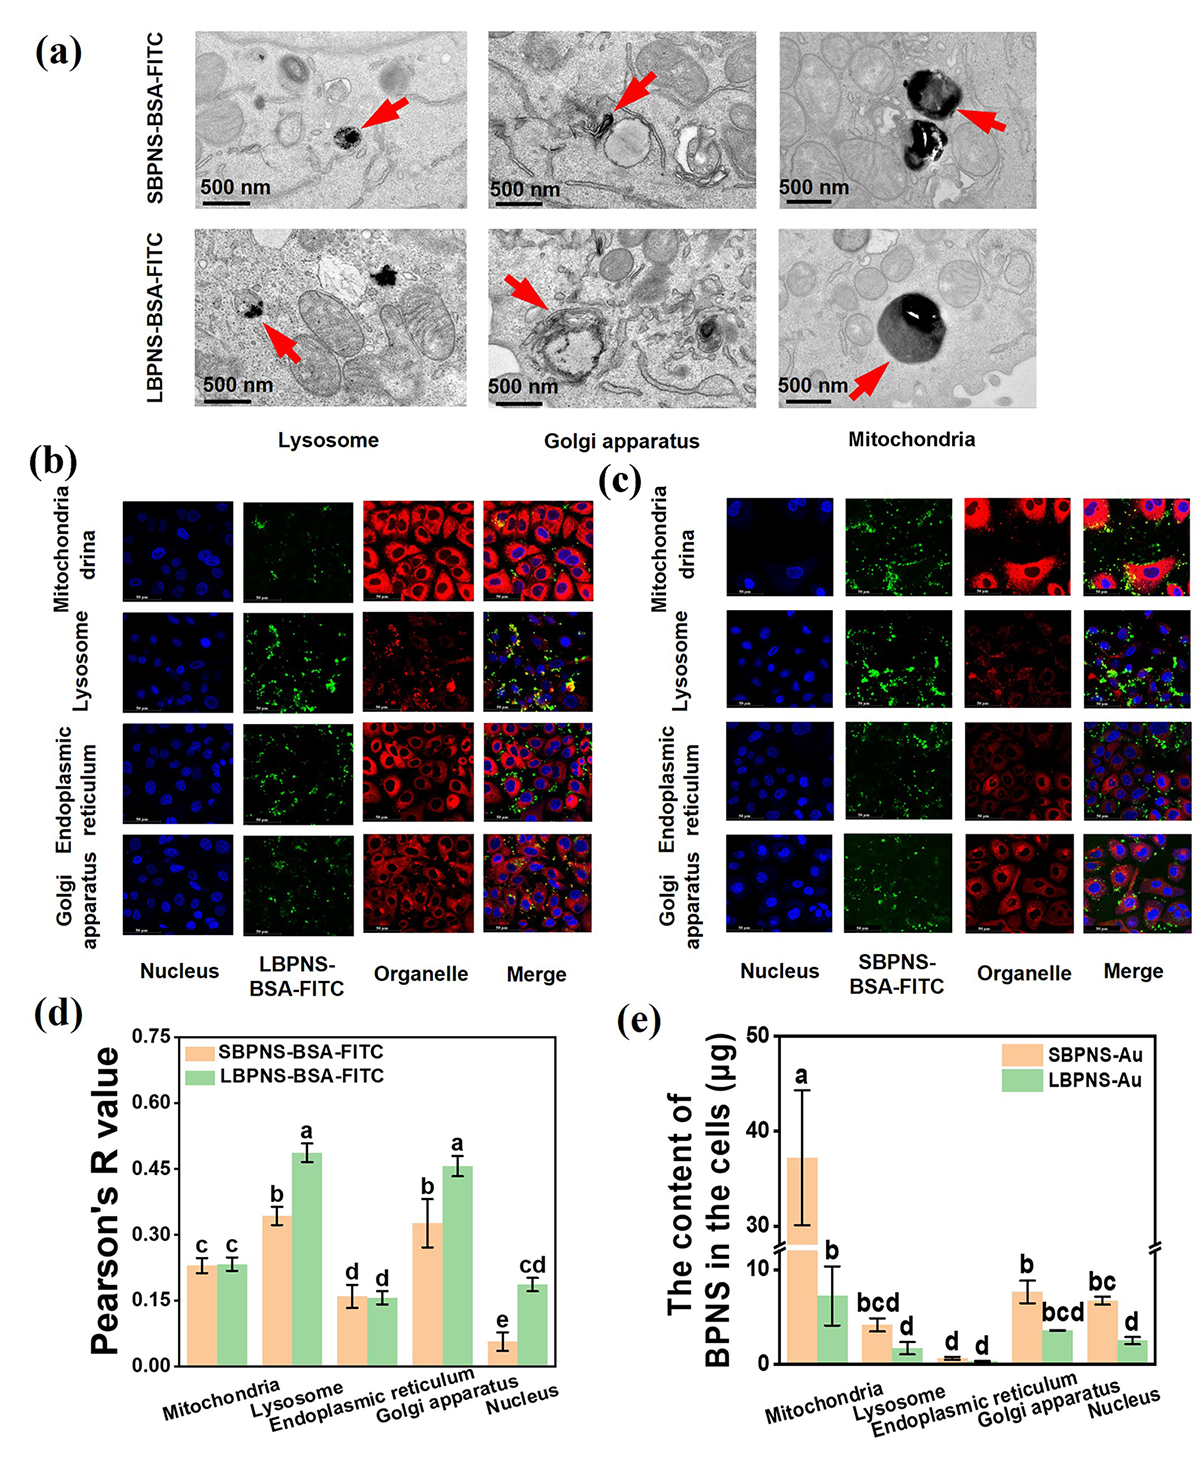
Distribution of SBPNS and LBPNS in cells. (a) TEM images of SBPNS-BSA-FITC and LBPNS-BSA-FITC in organelles such as Lysosome, Golgi apparatus, and Mitochondria. (b) Fluorescence confocal photographs of LBPNS-BSA-FITC in different organelles of A549 cells after 12 h of LBPNS-BSA-FITC exposure (green: LBPNS-BSA-FITC; blue: Nucleus; red: Endoplasmic Reticulum, Golgi apparatus, Mitochondrion, and Lysosome). (c) Fluorescence confocal photographs of SBPNS-BSA-FITC in different organelles of A549 cells after 12 h of SBPNS-BSA-FITC exposure (green: SBPNS-BSA-FITC; blue: Nucleus; red: Endoplasmic Reticulum, Golgi apparatus, Mitochondrion, and Lysosome). (d) Pearson’s co-localization coefficients of LBPNS-BSA-FITC or SBPNS-BSA-FITC with different organelles (n = 3). (e) LBPNS or SBPNS content in different organelles in BPNS-Au exposed cells (n = 3).
Current usage metrics show cumulative count of Article Views (full-text article views including HTML views, PDF and ePub downloads, according to the available data) and Abstracts Views on Vision4Press platform.
Data correspond to usage on the plateform after 2015. The current usage metrics is available 48-96 hours after online publication and is updated daily on week days.
Initial download of the metrics may take a while.