Figure 2
Download original image
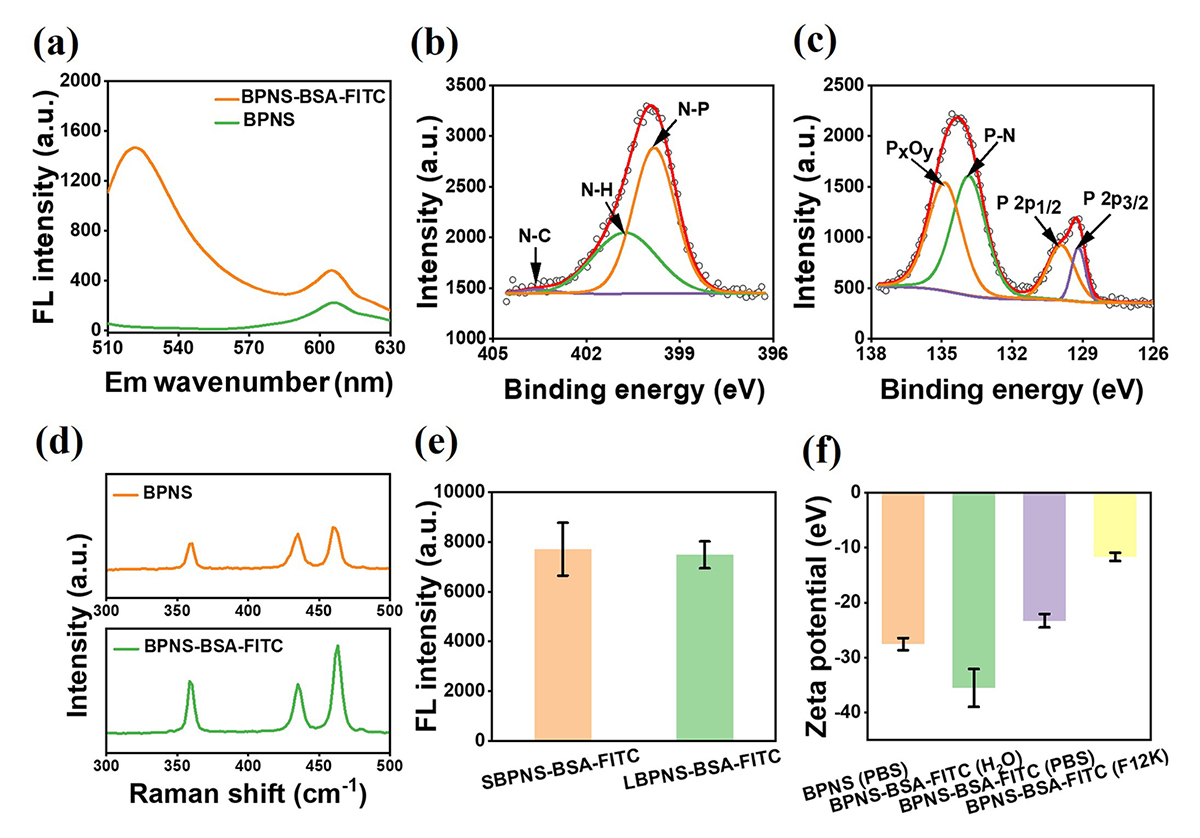
Characterization of BPNS and BPNS-BSA-FITC. (a) Fluorescence spectra of BPNS and BPNS-BSA-FITC (EX = 490 nm). (b) N1s spectra of BPNS-BSA-FITC samples characterized by XPS. (c) P2p spectra of BPNS-BSA-FITC samples characterized by XPS. (d) Raman spectra of BPNS and BPNS-BSA-FITC. (e) Fluorescence intensity of SBPNS-BSA-FITC and LBPNS-BSA-FITC (Ex = 490 nm, Em = 520 nm, n = 3). (f) Zeta potential of BPNS and BPNS-BSA-FITC in different environments (n = 3).
Current usage metrics show cumulative count of Article Views (full-text article views including HTML views, PDF and ePub downloads, according to the available data) and Abstracts Views on Vision4Press platform.
Data correspond to usage on the plateform after 2015. The current usage metrics is available 48-96 hours after online publication and is updated daily on week days.
Initial download of the metrics may take a while.