Figure 3
Download original image
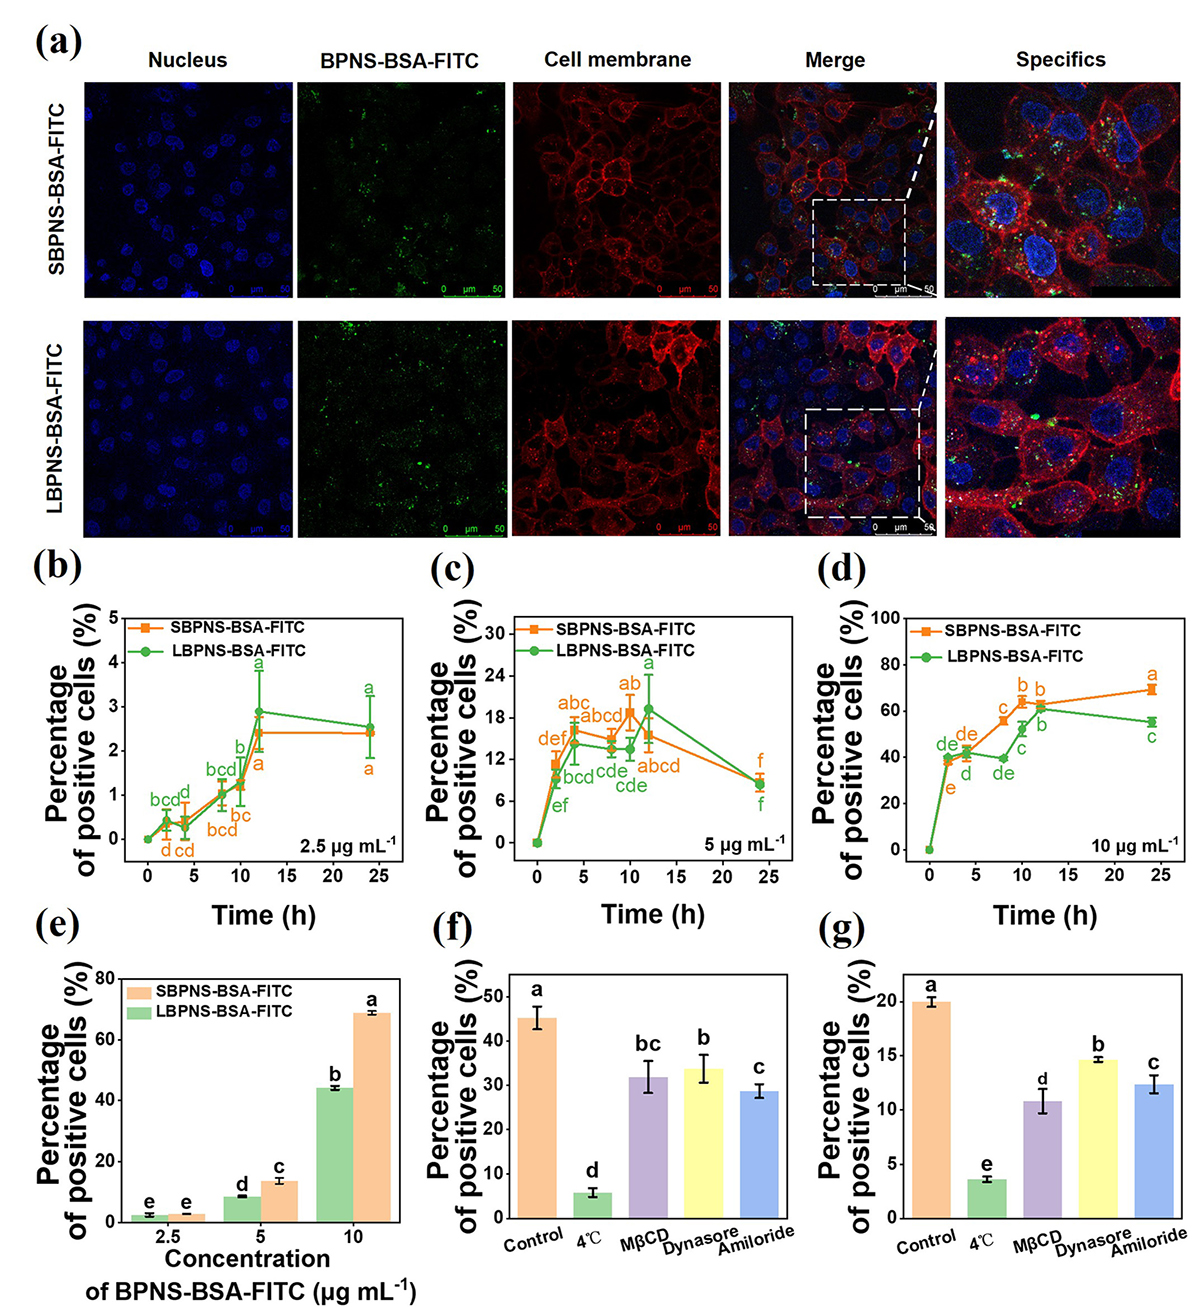
Uptake of LBPNS and SBPNS by cells. (a) Fluorescence confocal pictures of SBPNS-BSA-FITC and LBPNS-BSA-FITC inside the cell membrane. (b–d) Percentage of FITC-positive cells to total cell number in SBPNS-BSA-FITC and LBPNS-BSA-FITC (2.5, 5.0, and 10.0 μg/mL) exposed cells detected by flow cytometry (n = 3). (e) Percentage of FITC-positive cells to total cell number exposed to different concentrations of SBPNS-BSA-FITC and LBPNS-BSA-FITC for 34 h detected by flow cytometry (n = 3). (f) Percentage of FITC-positive cells to total cell number in different inhibitor-treated groups after 12 h exposure to 10 μg/mL SBPNS-BSA-FITC (n = 3). (g) Percentage of FITC-positive cells to total cell number in different inhibitor-treated groups after 12 h exposure to 10 μg/mL LBPNS-BSA-FITC (n = 3).
Current usage metrics show cumulative count of Article Views (full-text article views including HTML views, PDF and ePub downloads, according to the available data) and Abstracts Views on Vision4Press platform.
Data correspond to usage on the plateform after 2015. The current usage metrics is available 48-96 hours after online publication and is updated daily on week days.
Initial download of the metrics may take a while.