Figure 4
Download original image
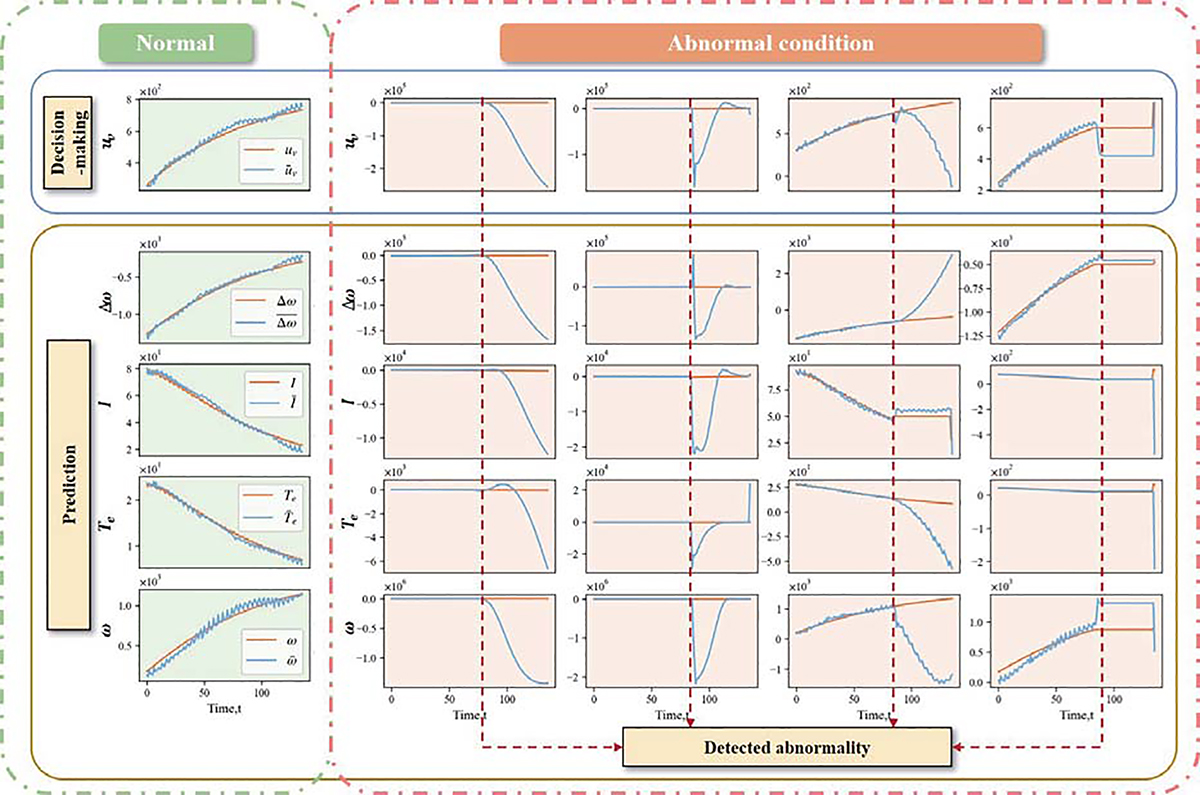
The performance of PINL in the context of motor speed control system. The blue line represents the predictions and inferences generated by PINL, while the orange line reflects the data collected from the ICS. The time step is set to 0.05 s, aligning the controller's sampling rate with this interval. The first column displays normal conditions in the absence of any internal faults or external intrusions. The second column depicts a scenario where a fault in the speed sensor results in a deviation from the actual value. The remaining three columns verify the performance of PINL under cyber attacks.
Current usage metrics show cumulative count of Article Views (full-text article views including HTML views, PDF and ePub downloads, according to the available data) and Abstracts Views on Vision4Press platform.
Data correspond to usage on the plateform after 2015. The current usage metrics is available 48-96 hours after online publication and is updated daily on week days.
Initial download of the metrics may take a while.