Open Access
Figure 2
Download original image
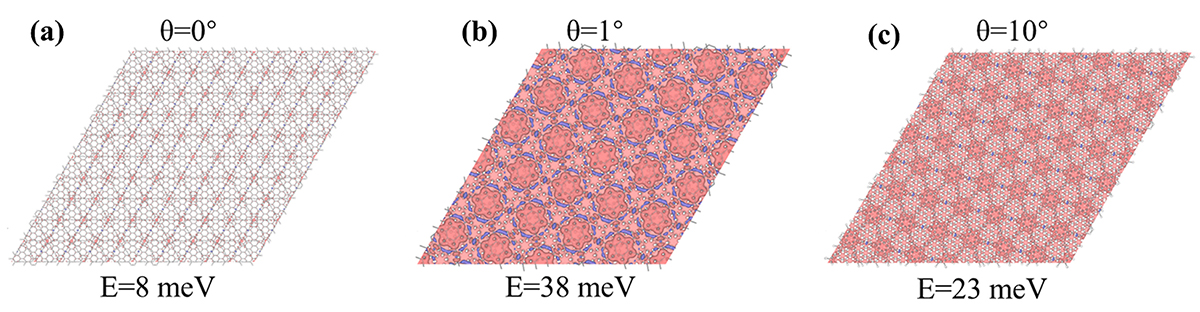
Electrostatic potential at three different angles of the TGG heterostructures. The blue isosurface indicates the high electrostatic potential region, and the red isosurface indicates the low electrostatic potential region. (a–c) Electrostatic potential in the GDY/graphene heterostructure with θ = 0°, 1°, 10°, respectively.
Current usage metrics show cumulative count of Article Views (full-text article views including HTML views, PDF and ePub downloads, according to the available data) and Abstracts Views on Vision4Press platform.
Data correspond to usage on the plateform after 2015. The current usage metrics is available 48-96 hours after online publication and is updated daily on week days.
Initial download of the metrics may take a while.