Figure 3
Download original image
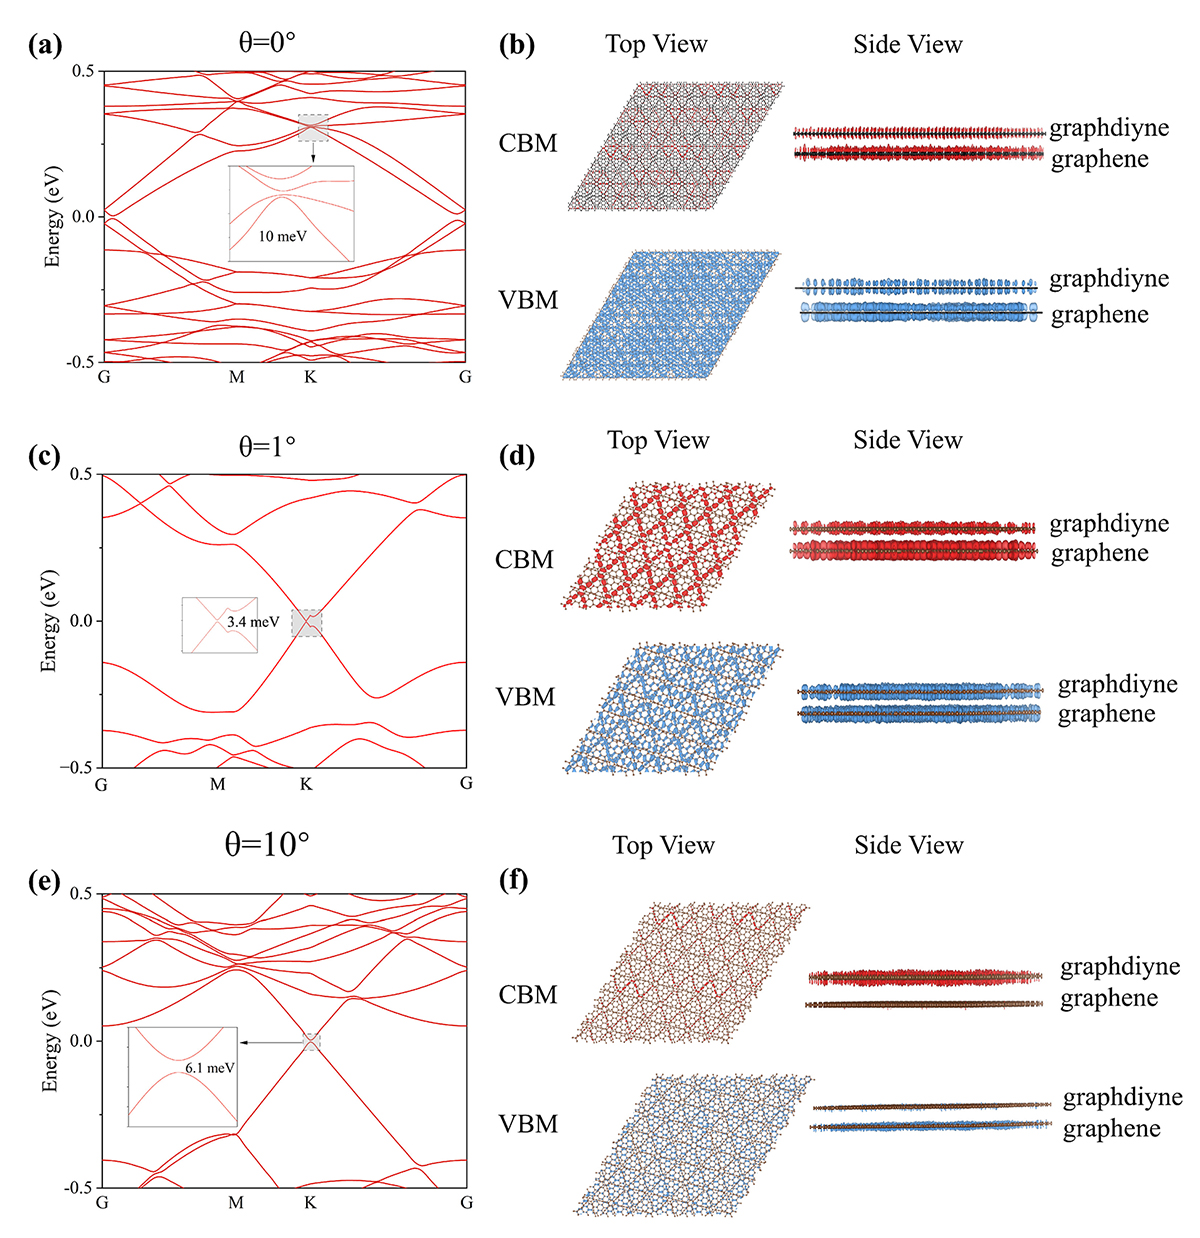
The electronic structure of the GDY/graphene heterostructures. (a) The band structure for the GDY/graphene heterostructure with θ = 0°. The CBM and VBM charge densities are shown in red and blue with the isosurface value establishing at 7 × 10⁻⁹ e Å−3, respectively. (b) Top and side views of the charge density of the CBM and VBM bands for the heterostructure with θ = 0°. The unit cell of the moiré lattice is indicated by the dashed box. (c) Band structure for the GDY/graphene heterostructure with θ = 1°. (d) Top and side views of the charge density of the CBM and VBM bands for the heterostructure with θ = 1°. (e) Band structure for the GDY/graphene heterostructure with θ = 10°. (f) Top and side views of the charge density of the CBM and VBM bands for the heterostructure with θ = 10°.
Current usage metrics show cumulative count of Article Views (full-text article views including HTML views, PDF and ePub downloads, according to the available data) and Abstracts Views on Vision4Press platform.
Data correspond to usage on the plateform after 2015. The current usage metrics is available 48-96 hours after online publication and is updated daily on week days.
Initial download of the metrics may take a while.