Figure 8
Download original image
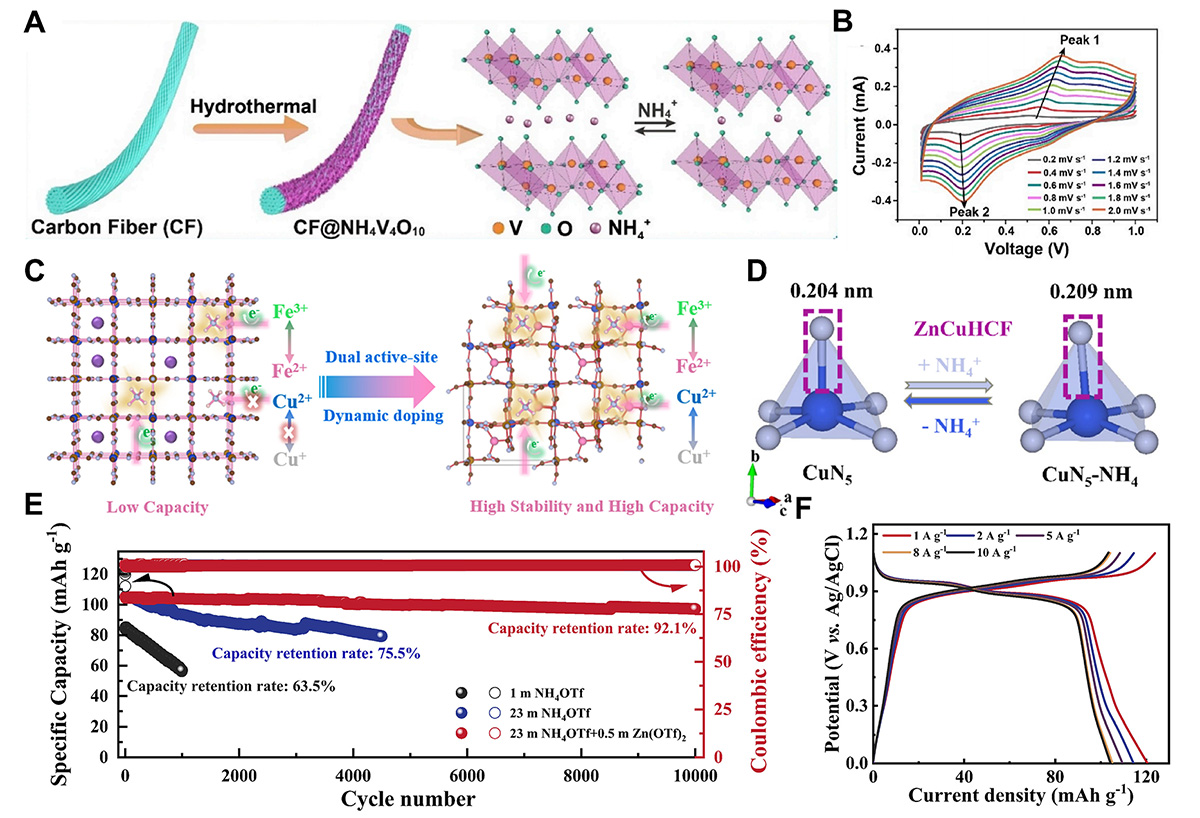
Research progress of FAABs. (A) Schematic illustration of the CF@urchin-like NH4V4O10. (B) CV curve of the FAABs. (A, B) Reproduced with permission from [94]. Copyright©2020, Elsevier. (C) Schematic illustration of in-situ dynamic compensation strategy. (D) Theoretical calculations of Cu–N bond length changes during ammoniation/de-ammoniation progresses in ZnCuHCF. (E) Cycling performance of the ZnCuHCF. (F) The GCD curves of ZnCuHCF. (C–F) Reproduced with permission from [95]. Copyright©2025, Wiley-VCH.
Current usage metrics show cumulative count of Article Views (full-text article views including HTML views, PDF and ePub downloads, according to the available data) and Abstracts Views on Vision4Press platform.
Data correspond to usage on the plateform after 2015. The current usage metrics is available 48-96 hours after online publication and is updated daily on week days.
Initial download of the metrics may take a while.