Figure 2
Download original image
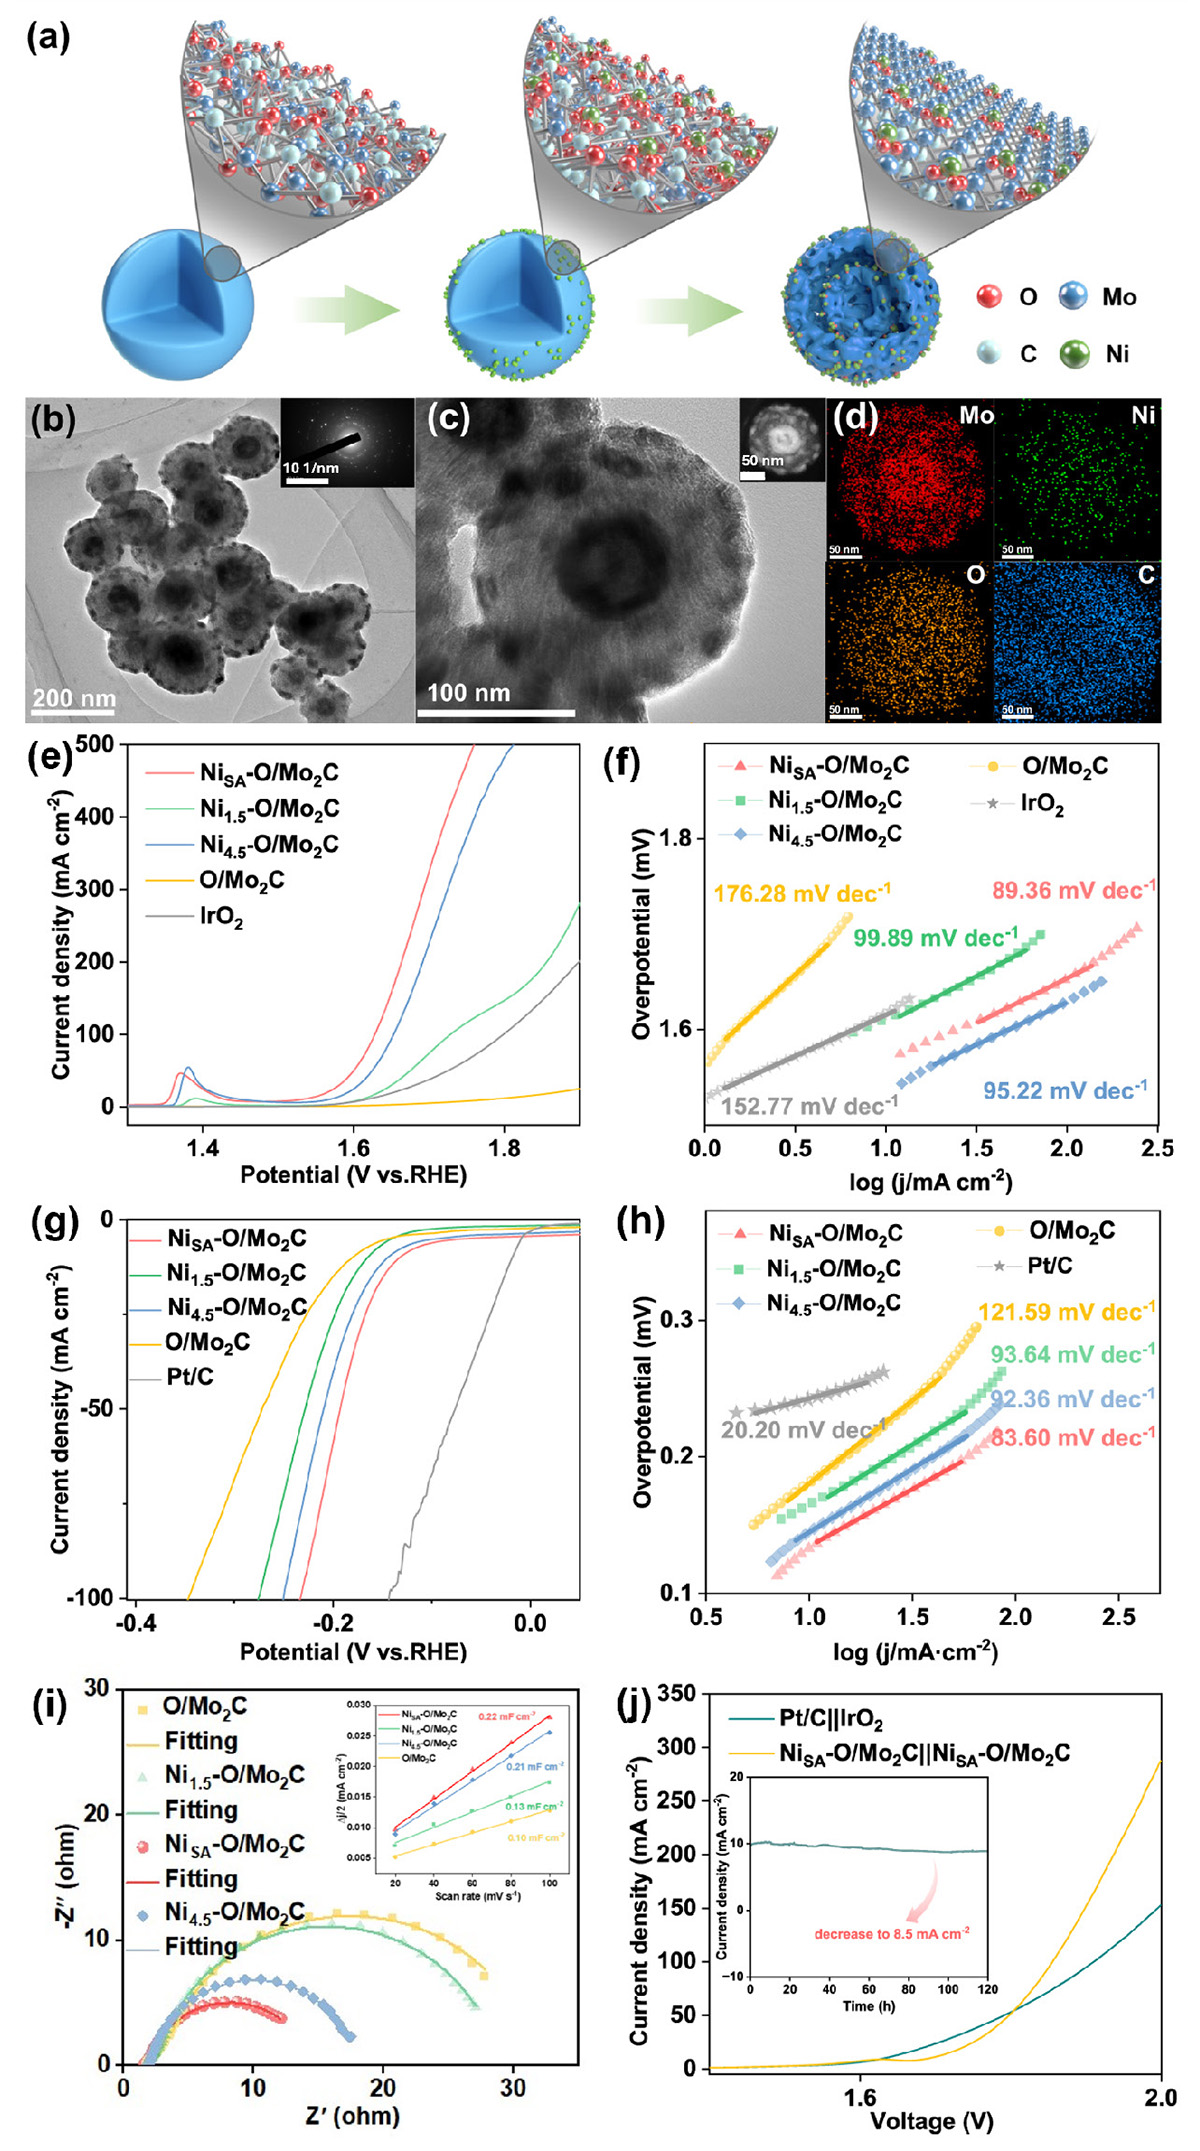
(a) Schematic illustration of the fabrication process of the NiSA–O/Mo2C electrocatalyst. (b, c) High-resolution transmission electron microscopy (HR-TEM) images of NiSA–O/Mo2C. Insets: selected area electron diffraction (SAED) patterns. (d) Elemental mapping of Mo, Ni, O and C for an individual NiSA–O/Mo2C nanosphere (inset of (c)), respectively. (e, f) Polarization curves and Tafel plots for NiSA–O/Mo2C, Ni1.5–O/Mo2C, Ni4.5–O/Mo2C, and pure O/Mo2C, commercial IrO2 for OER (loading amount 0.74 mg cm−2). (g, h) Polarization curve and Tafel plots for NiSA–O/Mo2C, Ni1.5–O/Mo2C, Ni4.5–O/Mo2C and pure O/Mo2C, 20% Pt/C for HER (loading amount 0.7 mg cm−2). (i) The Nyquist plots of O/Mo2C and NiSA–O/Mo2C, Ni1.5–O/Mo2C, Ni4.5–O/Mo2C. Inset is the long-term durability of overall water splitting at a current density of 10 mA cm−2. (j) Polarization curves of NiSA–O/Mo2C||NiSA–O/Mo2C and Pt/C||IrO2 couples for overall water splitting in 1.0 M KOH (loading amount 0.74 mg cm−2). Adapted from Ref. [17]. Copyright 2024, Springer Nature.
Current usage metrics show cumulative count of Article Views (full-text article views including HTML views, PDF and ePub downloads, according to the available data) and Abstracts Views on Vision4Press platform.
Data correspond to usage on the plateform after 2015. The current usage metrics is available 48-96 hours after online publication and is updated daily on week days.
Initial download of the metrics may take a while.