| Issue |
Natl Sci Open
Volume 5, Number 3, 2026
Special Topic: Hollow Multishelled Structure
|
|
|---|---|---|
| Article Number | 20260012 | |
| Number of page(s) | 20 | |
| Section | Materials Science | |
| DOI | https://doi.org/10.1360/nso/20260012 | |
| Published online | 13 March 2026 | |
REVIEW
Hollow nanostructures with controlled internal voids: Beyond simple surface area maximization of the electrocatalyst
1
Department of Chemistry and Center for Multielement Nanoparticle and Tectonics, Korea University, Seoul 02841, Republic of Korea
2
Department of Chemistry, Incheon National University, Incheon 22012, Republic of Korea
3
Department of Energy and Materials Engineering, Dongguk University, Seoul 04620, Republic of Korea
* Corresponding authors (emails: This email address is being protected from spambots. You need JavaScript enabled to view it.
(Taehyun Kwon); This email address is being protected from spambots. You need JavaScript enabled to view it.
(Kwangyeol Lee))
Received:
25
January
2026
Revised:
7
March
2026
Accepted:
12
March
2026
Abstract
Hollow nanostructured catalysts have traditionally been exploited to maximize surface area and intrinsic catalytic activity through structural and compositional engineering. Recent studies, however, reveal that hollow architectures play a more active role in shaping local reaction environments by regulating the transport and concentration of reactants, products, and reaction intermediates within confined spaces. This review summarizes recent advances in hollow electrocatalysts from the perspective of local concentration regulation at catalytic interfaces, highlighting how cavity-induced confinement effects influence reaction kinetics, selectivity, and stability. In this review, emerging design principles for tuning cavity size, shell thickness, and pore geometry to control mass transport and intermediate populations are discussed. Moreover, future opportunities and challenges, including confinement-driven catalyst design, operando characterization, and data-driven structural optimization, are outlined.
Key words: electrocatalysis / hollow nanostructures / surface area / mass-transport / intermediate population / cavity confinement
Contributed equally to this work.
© The Author(s) 2026. Published by Science Press and EDP Sciences.
 This is an Open Access article distributed under the terms of the Creative Commons Attribution License (https://creativecommons.org/licenses/by/4.0), which permits unrestricted use, distribution, and reproduction in any medium, provided the original work is properly cited.
INTRODUCTION
Nanostructured catalysts with hollow interior, including nanocages and nanoframes, have long been recognized as an effective architectural motif to improve catalytic performances [1,2]. This primarily originates from the introduction of internal voids, increasing specific surface area, which also improves material utilization [3]. Early studies were largely focused on surface area expansion and maximization of the catalytically active sites [4]. At this stage, the internal cavity was mainly regarded as a geometric means to expose more surface atoms, and catalytic enhancement was largely interpreted through conventional surface-area-driven arguments.
Subsequently, research efforts have shifted toward tuning intrinsic catalytic activity through deliberate structural and compositional engineering (phase control, lattice strain control, etc.), as well as improving their structural stability [5,6]. Hollow architectures were found to be particularly advantageous for such purposes, as thin shells, frame-like motifs, and porous walls inherently introduce undercoordinated surface atoms, strain fields, and composition gradients that can modify adsorption energetics and reaction barriers [7,8]. Within this conventional framework, hollow structures were predominantly understood through structure–property relationships aimed at improving intrinsic activity rather than actively shaping the local environment around the catalysts [9,10].
Recent advances, however, reveal that hollow cavities play a far more active role than previously assumed. Beyond structural advantages, hollow architectures can significantly regulate the local concentrations of reactants, products, and surface chemical species by modifying mass transport, diffusion pathways, and residence times in confined spaces. Such cavity-induced concentration effects generate local chemical environments that deviate from the bulk, directly influencing reaction kinetics, selectivity, and stability. Importantly, these effects cannot be captured solely by surface area metrics or conventional porosity descriptors. To rationalize these emerging roles, we organize hollow nanoarchitectures according to their fundamental structure variables, including representative architectures and tunable design parameters in Figure 1b. These design features influence surface area effects, transport modulation, and intermediate confinement in hollow catalysts. In this review, recent studies in which hollow nanostructures function as local concentration regulators at catalytic interfaces are discussed. In particular, how hollow cavities control (i) reactant and product fluxes through transport modulation and (ii) the concentration of key intermediate species governing multi-electron reaction pathways are mainly highlighted.
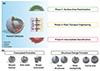 |
Figure 1 (a) Schematic illustration summarizing the conceptual evolution of hollow electrocatalyst, from surface area maximization (phase 1), to mass transport engineering (phase 2), and further to intermediate densification (phase 3). (b) Schematic overview of hollow nanoarchitecture design, illustrating representative structural models and key parameters such as shell thickness, shell multiplicity, and cavity size. |
MASS TRANSPORT ENGINEERING: CONTROL OF LOCAL CONCENTRATION OF REACTANTS AND PRODUCTS
Electrocatalytic performance has traditionally been interpreted through intrinsic catalytic activity and surface chemistry. However, as reaction rates increase, particularly in electrochemical systems involving gaseous species, performance often becomes limited by the delivery and removal of reactants and products rather than by active-site kinetics alone [11]. Under such conditions, local concentration gradients emerge at the catalytic interface, directly suppressing achievable current densities and efficiencies. This transport limitation is most evidently recognized at the device level. For example, in a water electrolyzer and fuel cell membrane-electrode assembly (MEA), electrochemical reactions inherently occur at the three-phase boundary (TPB) where the solid catalyst, liquid electrolyte, and gas phase coexist [12,13]. Therefore, extensive efforts have been devoted to engineering gas diffusion layers (GDLs) and microporous layers (MPLs), in which pore size, connectivity, and hierarchical organization are deliberately optimized to regulate electrolyte penetration and gas diffusion, thereby sustaining favorable reactant and product fluxes [14,15]. In this section, we focus on how hollow architectures regulate mass transport through qualitative and quantitative analyses.
Quantitative analysis of mass transport in hollow catalysts
Despite the well-established importance of transport regulation at the macroscopic GDL/MPL level, analogous considerations have historically been less emphasized at the catalyst architecture level. More recently, this gap has begun to narrow, as catalyst designs increasingly incorporate transport-oriented features. In this context, hollow nanostructures provide a compelling platform for translating macroscopic pore-hierarchy concepts into nanoscale catalyst architectures, enabling regulation of reactant and product concentrations directly at confined catalytic interfaces. Mechanistically, they can facilitate mass transport by introducing geometry-induced changes in the local hydrodynamic environments, including capillary effects, modified pressure distributions, and flow velocities within their confined cavities. Accordingly, mass transport-oriented design philosophy has been extended to the electrode architecture toward the catalyst layer itself, recently. This shift has been motivated in part by the frequent discrepancy observed between half-cell evaluations and MEA single cell performances, where catalysts exhibiting excellent intrinsic activity under idealized conditions often fail to deliver comparable performance in practical devices. Such gaps highlight that catalytic performance under device-relevant operation is strongly influenced by transport processes rather than intrinsic activity alone. In this context, Kim et al. [16] reported Ir-based jagged nanotube catalysts that exhibited markedly improved performance in proton exchange membrane (PEM) water electrolyzer compared with Ir nanoframes and Ir black, particularly under MEA single cell conditions. While half-cell measurements suggested only moderate performance differences between nanoframes and nanotubes, the advantage of the jagged nanotube architecture became pronounced at the device level, where the hierarchical and hollow morphology was proposed to facilitate reactant delivery and product removal through enhanced mass transport. This example highlights a broader trend toward incorporating transport-oriented considerations into nanoscale catalyst architecture design.
Considering these observations, hollow nanostructures emerge as particularly promising platforms for regulating mass transport in the electrocatalysts. By introducing internal cavities and hierarchical porosity spanning nanometer to sub-micrometer length scales, hollow architectures can modulate diffusion pathways, residence times, and fluxes of reactants and products in confined environments. This mode of transport regulation is conceptually analogous to the pore hierarchy engineered in macroscopic GDL/MPL systems, yet operates directly at the catalyst level, where local concentration fields critically influence electrochemical performance.
Several studies have demonstrated that hollow catalysts exhibit enhanced oxygen evolution reaction (OER) and hydrogen evolution reaction (HER) performance compared with their solid counterparts, an effect that is frequently associated with improved mass transport characteristics, facilitated gaseous species diffusion, and increased accessibility of active sites. Hou et al. [17] reported oxidized Ni single atom on the Mo2C support (NiSA-O/Mo2C) as the electrocatalyst for overall water splitting in 1.0 M KOH (Figure 2a–d). The OER activity of NiSA-O/Mo2C exhibited the best overpotential of 299 mV at 10 mA cm−2 among the counterparts, especially better than commercial IrO2 (386 mV). Also, the Tafel slope showed 89.36 mV dec−1, which is smaller than IrO2 (155.77 mV dec−1), representing the fast charge transfer. The authors measured HER activities as well, NiSA-O/Mo2C possessed an overpotential of 133 mV at 10 mA cm−2 and a Tafel slope of 83.6 mV dec−1 (Figure 2e–h). As shown in Figure 2i and its inset, NiSA-O/Mo2C exhibits the smallest Rct value, indicating the most favorable charge transfer kinetics, together with the largest electrochemical surface area (ECSA) among the compared catalysts. Furthermore, the assembled electrolyzer using NiSA–O/Mo2C (NiSA–O/Mo2C||NiSA–O/Mo2C) required to achieve 10, 100, and 150 mA cm−2 for 1.69, 1.86, and 1.90 V, while Pt/C||IrO2 required 1.64, 1.91, and 1.93 V, respectively (Figure 2j). Beyond overall performance metrics alone, increasing attention has been directed toward understanding how micro- and nanoscale shell structures influence transport-related properties at catalytic interfaces.
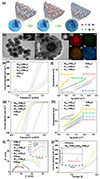 |
Figure 2 (a) Schematic illustration of the fabrication process of the NiSA–O/Mo2C electrocatalyst. (b, c) High-resolution transmission electron microscopy (HR-TEM) images of NiSA–O/Mo2C. Insets: selected area electron diffraction (SAED) patterns. (d) Elemental mapping of Mo, Ni, O and C for an individual NiSA–O/Mo2C nanosphere (inset of (c)), respectively. (e, f) Polarization curves and Tafel plots for NiSA–O/Mo2C, Ni1.5–O/Mo2C, Ni4.5–O/Mo2C, and pure O/Mo2C, commercial IrO2 for OER (loading amount 0.74 mg cm−2). (g, h) Polarization curve and Tafel plots for NiSA–O/Mo2C, Ni1.5–O/Mo2C, Ni4.5–O/Mo2C and pure O/Mo2C, 20% Pt/C for HER (loading amount 0.7 mg cm−2). (i) The Nyquist plots of O/Mo2C and NiSA–O/Mo2C, Ni1.5–O/Mo2C, Ni4.5–O/Mo2C. Inset is the long-term durability of overall water splitting at a current density of 10 mA cm−2. (j) Polarization curves of NiSA–O/Mo2C||NiSA–O/Mo2C and Pt/C||IrO2 couples for overall water splitting in 1.0 M KOH (loading amount 0.74 mg cm−2). Adapted from Ref. [17]. Copyright 2024, Springer Nature. |
The importance of the micro-nano structure of catalysts’ shell, which highly affects mass transport, was emphasized by Hou et al. [18]. They engineered Co3O4 hollow multishell structures (HoMSs) by modulating the phosphorization process, resulting in B-CoP-HoMSs, D-CoP-HoMSs, and CoP-HoMSs (Figure 3a–d). D-CoP-HoMSs performed the highest catalytic activity with the smallest overpotentials of 93 and 294 mV at 10 mA cm−2 for HER and OER, respectively (Figure 3e, g). Also, the Tafel slope of 50 and 67 mV dec−1, the smallest value among the synthesized catalysts, indicated that the close duplicated shell structure with an interspacing of ~30 nm enhanced electrocatalytic kinetics (Figure 3f, h). The smallest Rct supported feasible charge transfer as well (Figure 3i). The authors measured the hydrophilicity and aerophobicity of D-CoP-HoMSs, B-CoP-HoMSs, and CoP-HoMSs. Consequently, a small space in the shell of D-CoP-HoMSs provided a stronger capillary force that drives liquid diffusion, consistent with the smallest water drop contact angle and the largest bubble contact angle (Figure 3j). The reduced internal shell spacing promotes capillary-driven liquid diffusion and rapid electrolyte replenishment after bubble release, while facilitating efficient gas desorption from the catalyst surface, thereby sustaining continuous mass transport within the confined hollow structure. Such wettability-regulated interfacial characteristics are critical determinants of TPB mass transfer in gas-evolving electrocatalytic systems. It has been demonstrated that optimized electrode wettability can facilitate electrolyte infiltration and rapid bubble detachment at the catalyst layer, thereby alleviating local mass transport limitations [19,20].
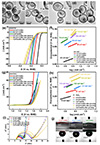 |
Figure 3 (a–d) Low- and high-magnification (inset) TEM images of Co3O4-HoMSs and samples after phosphorization reaction for 2 h (B-CoP-HoMSs), 4 h (D-CoP-HoMSs), and 8 h (CoP-HoMSs). The scale bars of inset images are 50 nm. (e, f) HER LSV and Tafel plots of HoMS samples before and after grinding and Pt/C, recorded at a scan rate of 5 mV s−1 in 1.0 M KOH electrolyte. (g, h) OER LSV and Tafel plots of HoMS samples before and after grinding and RuO2, recorded at a scan rate of 5 mV s−1 in 1.0 M KOH electrolyte. (i) EIS Nyquist plots of HoMS samples before and after grinding. (j) Water contact angle images of 2 μL liquid drops on B-CoP-HoMSs, D-CoP-HoMSs, and CoP-HoMSs, and bubble contact angle images of HoMSs under water. Adapted from Ref. [18]. Copyright 2021, Wiley-VCH GmbH. |
Together, the qualitative evidence provided that fine-tuned hollow structures could fortify not only charge transfer but also mass transport.
Qualitative analysis of mass transport in hollow catalysts
While such structural effects qualitatively suggest enhanced mass transport, quantitative analysis is required to directly assess how hollow architectures reshape local concentration and diffusion behavior. For instance, Liu et al. [21] formed carbon dots (CDs) onto the hollow Mo2C (CD-Mo2C) to accelerate H* desorption for hydrogen evolution activity (Figure 4a–c). The optimized catalyst, CD@Mo2C-3, exhibited an overpotential of 57 mV at 10 mA cm−2 with a Tafel slope of 96 mV dec−1, the smallest Rct in 1.0 M KOH, and the largest ECSA (Figure 4e–h). Beyond the experimental observations, finite element simulations (FES) were employed to analyze the concentration of H+ and H2 within the hollow nanoreactor, providing model-based quantitative insight into mass transport behavior in confined architectures (Figure 4i–n). The simulations indicated that the introduction of CD on the surface of Mo2C primarily influenced local reaction-transport behavior by altering concentration and pressure distribution (Figure 4o–q). These concentration and pressure profiles are derived from numerical simulations, underscoring the importance of computational approaches in elucidating the mass transport mechanism within hollow-structured electrocatalysts.
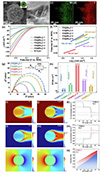 |
Figure 4 (a, b) Scanning electron microscopy (SEM) and HR-TEM images of CD@Mo2C-3. (c, d) Elemental mapping of Mo and C for CD@Mo2C-3. (e, f) Polarization curves and corresponding Tafel slops of CD@Mo2C catalysts. (g) Nyquist plots at −1.17 V (vs. SCE). (h) A bar diagram of ECSA for the series of CD@Mo2C nanoreactors. (i–k) H+ concentration around Mo2C and CD@Mo2C nanoreactor. (l–n) H2 concentration around Mo2C and CD@Mo2C nanoreactor. (o–q) Surface pressure fields for Mo2C and CD@Mo2C nanoreactor. Adapted from Ref. [21]. Copyright 2024, Elsevier. |
Beyond single-system analysis, comparing transport behavior across distinct hollow geometries provides deeper insight into how architectural parameters govern mass transport at the nanoscale. In a related computational study, hierarchical nanosheets stacked phosphorus-oxygen incorporated cobalt sulfide (Co-OSP) hollow micro/nano-reactor as electrochemical bifunctional OER/HER catalysts [22]. The hollow ball-in-ball morphology of Co-OSP was prepared by sequential sulphuration and phosphorization of the cobalt alkoxide sphere (Figure 5a–d). For OER, the catalyst exhibited an overpotential of 175.3 mV with the lowest Tafel slope among the compared samples (Figure 5e, f). From the linear relationship between scan rate and cyclic voltammetry (CV) current density differences in Figure 5g, Co-OSP-0.2 is determined to possess the highest Cdl (75.9 μF cm−2), indicating the largest ECSA. Besides, HER performances evaluated that overpotential of 132.7 mV at 10 mA cm−2 with Tafel slope of 79.4 mV dec−1 (Figure 5h, i). The electrochemical impedance spectroscopy (EIS) further represents that Co-OSP-0.2 shows the fastest reaction kinetics (Figure 5j). The improvement of electrocatalytic performance was elucidated by finite element analysis (FEA), unveiling mass transport behavior by simulating the flow rate. The three morphology models were introduced in the FEA: solid sphere, hollow sphere, and ball-in-ball sphere (Figure 5k–m). The simulation results showed the flow field distribution of the exterior surface of three models representing similar kinetics, indicating similar mass transport. As expected, the solid sphere model exhibited a flow rate of zero in their core region. While the hollow sphere model showed a slight increase in internal velocity of 0.5 × 10⁻³ m s−1 of flow rate, the ball-in-ball model reached 1.5 × 10⁻³ m s−1, suggesting that the ball-in-ball morphology is favorable for mass transfer and diffusion (Figure 5n). The simulation further reveals that the flow velocity increases toward the center of the morphology, leading to an enhanced inlet flow and suggesting structure-dependent transport trends that provide useful mechanistic guidance for understanding mass transport behavior in hollow architectures.
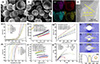 |
Figure 5 (a, b) SEM images of Co-OS sphere and Co-OSP sphere. (c) Elemental mapping images of Co, O, S, and P elements. (d) HR-TEM image. (e, f) OER polarization curves and corresponding Tafel slots. (g) The calculated electrochemical Cdl plot. (h, i) HER polarization curves and corresponding Tafel slots. (j) EIS plot. Velocity field distributions of different morphology models for (k) solid sphere, (l) hollow sphere, and (m) ball-in-ball structural sphere. (n) Flow velocity variation along the middle position of ball-in-ball model. Adapted from Ref. [22]. Copyright 2023, Elsevier. |
Another research employed hollow carbon spheres as a template to construct Ru-based nanoreactors for HER. Three kinds of hollow catalysts, single-shell Ru nanoreactor (Ru-SSC), Ru in the inner layer of double-shell of hollow carbon (Ru-DSC-I), and external layer (Ru-DSC-E), were synthesized by Liu et al. [23] (Figure 6a–d). Among them, Ru-DSC-I delivered an overpotential of 73.5 mV at 10 mA cm−2 with a Tafel slope of 83.7 mV dec−1, even better than commercial Pt/C (Figure 6e, f). EIS showed the smallest Rct for Ru-DSC-I, indicating better charge transfer kinetics than the other configurations (Figure 6g). In addition, Figure 6h shows that the Ru-DSC-I possesses an ECSA of 404.6 m2 g−1, which is more than 3-fold higher than that of Ru-SSC. To further examine the mass transport-related contributions, FEA was adopted on the single- and double-shell models. In Figure 6i–l, the simulated two-dimensional (2D) fluid velocity distribution maps and line-profile data indicated that the maximum internal flow velocity reached 0.8 × 10⁻² m s−1, which was 20-fold higher than that of the single-shell structure. Additionally, vortex distribution simulations revealed that the double-shell model exhibited stronger internal circulation compared with the single-shell, suggesting rapid fluid mixing that promotes mass transport (Figure 6m, n).
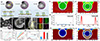 |
Figure 6 (a) Schematic illustration of the Ru-SSC, Ru-DSC-I, and Ru-DSC-E. (b–d) TEM, HR-TEM, and HAADF-HRTEM images with enlarged selected areas and corresponding elemental mappings of Ru-DSC-I. (e, f) HER polarization curves and corresponding Tafel slots. (g) The EIS curves and corresponding equivalent circuit model for the Ru-SSC, Ru-DSC-I, and Ru-DSC-E at open-circuit voltages. (h) ECSA values of catalysts. (i, j) The velocity fields and streamline distributions of single-shell and double-shell models. (k, l) Corresponding velocity plots from A to B. (m, n) The 2D mapping images of the vortex fields in the single-shell and double-shell models. Adapted from Ref. [23]. Copyright 2024, American Chemical Society. |
INTERMEDIATE DENSIFICATION: LOCAL CONCENTRATION REGULATION
We now turn to the confinement-driven regulation of key reaction intermediates within hollow architectures. Beyond reactant and product concentration around the electrocatalysts, electrochemical reactions are often governed by the surface coverage and lifetime of key reaction intermediates rather than by intrinsic adsorption energetics alone. Particularly, controlling intermediate populations at the catalytic interface has emerged as a critical design challenge for achieving both active and selective electrocatalysis [24–26]. In reactions such as electrochemical CO2 reduction (CO2RR) and nitrate reduction (NO3RR), subtle changes in the local concentration of reactive intermediates can shift dominant reaction pathways, suppress competing reactions, and markedly alter product selectivity. For example, in CO2RR, the utilization of CO intermediates (*CO) for C–C coupling has been identified as the most effective and selective route for producing multi-carbon (C2+) products [27]. Similarly, in NO3RR, controlling the residence time of N-containing intermediates has been demonstrated to be an effective strategy for suppressing side reactions and facilitating collective proton delivery, thereby enabling unprecedentedly high ammonia (NH3) production [28]. From this perspective, hollow nanostructures provide a unique architectural platform for regulating intermediate concentrations through spatial confinement. By restricting diffusion and extending the residence time of reactive species within confined cavities, hollow architectures can locally amplify intermediates such as CO or nitrogen-containing species, increase effective collision frequency, and enable reaction pathways that are inaccessible on open or non-confined surfaces. This function of hollow cavities extends beyond the regulation of reactant and product transport discussed in the previous section, representing a distinct design paradigm in which catalyst architecture directly governs intermediate populations and reaction pathways.
Electrochemical CO2 reduction
A breakthrough demonstration of hollow-structured Cu catalysts for e-CO2RR was achieved through the rational design of porous Cu cavities formed via the in situ electrochemical reduction of Cu2O precursors (Figure 7a, b) [29]. This system exhibited a remarkable Faradaic efficiency (FE) for C2+ products of 75.6% and a partial current density of 605 mA cm−2 at −0.59 V vs. RHE in a microfluidic flow cell (Figure 7c, d). In situ Raman spectroscopy, cavity Cu2O revealed enrichment of *CO intermediates relative to solid Cu2O. Complementarily, finite element method (FEM) simulations suggested that the cavity geometry induces a concentration gradient that favors the accumulation of *CO within the hollow structure (Figure 7e–h). While the local CO amplification inside the cavity is inferred from simulation rather than directly measured, the modeling results are consistent with the spectroscopic observations and collectively support the proposed enhancement of C–C coupling toward C2+ products.
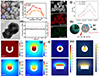 |
Figure 7 (a, b) Structural characterization of the cavity Cu2O precursor: SEM and TEM images. (c) C2+ partial current densities. (d) Stability test of cavity Cu throughout 12 h of CO2 electrolysis at 200 mA cm–2. Calculated concentration and distribution of species: CO2 (e), C1 (f), C2 (g), and C3 (h) concentrations on the cavity structure. The units of the CO2, C1, C2, and C3 concentrations were all mM in the color scale, and the scale bars are 100 nm. Adapted from Ref. [29]. Copyright 2023, American Chemical Society. (i) SEM-energy dispersive X-ray spectroscopy (EDS) mapping showing hollow structure and homogenous distribution of Cu and Zn. (j) Change of FE of C2+ product at different Cu/Zn atomic composition. (k) Schematic illustration of Cu6Zn-h catalyst giving C2+ product. Simulated concentration and flux distribution of (l) CO in Cu6Zn-h and Cu6Zn-b, (m) simulated concentration of OH− in Cu6Zn-h and Cu6Zn-b (color scale, concentration in mM). Adapted from Ref. [30]. Copyright 2025, Wiley-VCH GmbH. |
Following the demonstration that cavity-driven *CO enrichment promotes C–C coupling, research efforts expanded to incorporate heteroatoms. Because elevated local *CO concentrations facilitate CO dimerization, heteroatoms that enhance CO formation can synergistically interact with cavity geometries, further increasing local *CO concentrations. Zn-doped Cu2O nanocrystals represent a representative example of this strategy (Figure 7i) [30]. A hollow CuO-ZnO catalyst (Cu6Zn1-h) exhibits markedly enhanced performance compared with a non-hollow CuO-ZnO control (Cu6Zn1-b) at a high current density of 300 mA cm−2, delivering a 50% FE toward C2+ alcohols and an overall C2+ FE of 81%, thereby underscoring the practical relevance of this approach (Figure 7j, k). Mechanistically, Zn incorporation serves as a *CO promoter and, in concert with the cavity geometry, modulates *CO binding strength to avoid over-stabilization of intermediates. The confinement effect of reaction intermediates was examined using COMSOL multiphysics FEM simulations, which suggested that CO molecules and OH− ions preferentially accumulate within nanocavities relative to non-hollow catalysts (Figure 7l, m). While this preferential trapping is inferred from modeling rather than directly quantified experimentally, the simulation results are consistent with the observed enhancement in C2+ production.
This study exemplifies how heteroatom chemistry and nanoscale structural engineering can be synergistically integrated to enhance C2+ selectivity.
The most recent refinement in cavity engineering for CO2RR arises from a systematic investigation of how cavity size and shell thickness govern C2+ coupling selectivity in Au@Cu2O yolk-shell nanoreactors (Figure 8a–c) [31]. In this study, three distinct morphologies with precisely controlled structural parameters were directly compared, revealing a pronounced structure-selectivity relationship. Au@Cu2O-L, featuring a large cavity (192 nm) and a thick shell (111 nm), exhibited dominant CH4 production (Figure 8d–f). In contrast, Au@Cu2O-S, with a smaller cavity (113 nm) and a thinner shell (46 nm), displayed the opposite selectivity trend, achieving a C2H4 FE as high as 72.1%. The intermediate structure, Au@Cu2O-1, with optimized dimensions (shell thickness 66 nm and cavity size 151 nm), delivered the highest overall C2+ FE of 76%.
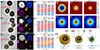 |
Figure 8 (a) EDX mapping images and TEM Au@Cu2O-L NRs. (b) EDX mapping images and TEM Au@Cu2O-M NRs. (c) EDX mapping images and TEM Au@Cu2O-S NRs. FEs of various reduction products at different potentials tested in a flow-cell with 1.0 M KOH electrolyte for (d) Au@Cu2O-L-10, (e) Au@Cu2O-M-10, and (f) Au@Cu2O-S-10 NRs, respectively. (g, h) Computed concentration distribution of CO2 and CO species of Au@Cu2O-L. (i, j) Computed concentration distribution of CO2 and CO species of Au@Cu2O-M. (k, l) Computed concentration distribution of CO2 and CO species of Au@Cu2O-S. (m) Schematic diagram of the cavity-confined catalytic mechanism of Au@Cu2O-x NRs. Adapted from Ref. [31]. Copyright 2025, Springer Nature. |
FEM simulations revealed that shell thickness and cavity size critically govern ECO2R product distributions in Au@Cu2O-x NPs (Figure 8g–i). Thick shells (Au@Cu2O-L) restricted CO2 diffusion, resulting in limited *CO accumulation, whereas thin shells (Au@Cu2O-S) enabled rapid CO2 transport, leading to high *CO enrichment and enhanced C–C coupling via partial spillover. Au@Cu2O-M showed intermediate behavior, balancing CO2 diffusion and *CO confinement. While these diffusion and intermediate-distribution effects are inferred from simulation rather than directly measured in situ, the modeling trends are consistent with the experimentally observed selectivity differences. These results demonstrate that neither too large (poor confinement) nor too small (mass-transport limitations) but optimally tuned hollow nanostructures can maximize the productive collision frequency of *CO intermediates (Figure 8m).
Electrochemical nitrate reduction
While CO2RR highlights how hollow cavities amplify a single dominant intermediate to promote C–C coupling, the relevance of intermediate concentration control becomes even more pronounced in multistep reactions involving multiple reactive intermediates, such as NO3RR. The NO3RR is required to have a complex 8-electron/9-proton transfer process that generates multiple reactive nitrogen intermediates (*NO3, *NO2, *NO, *NOH, *NH2, *NH3). Recent advances in hollow-structured catalysts have demonstrated that hollow and yolk-shell nanostructures provide an ideal microenvironment for controlling N-intermediate residence time, suppressing competing reactions, and facilitating proton delivery, collectively enabling unprecedentedly high NH3 FE.
The hollow-structured PdCu catalyst (PdCu-H), designed through microenvironment engineering, exemplifies the superiority of this structural strategy for e-NO3RR (Figure 9a) [32]. The PdCu-H catalyst delivered a high  of 87.3% along with an excellent NH3 yield rate of 0.551 mmol h−1 mgcat−1 (Figure 9b, c). The role of the hollow structure in confining reactants during NO3RR was confirmed by examining the
  and NH3 yield of PdCu-H at different rotation rates (Figure 9d). Increasing the rotation rate markedly decreased
  for PdCu-H, while PdCu-P showed only a minor change. Since the higher rotating rates would accelerate the removal of key intermediates, these results demonstrate that the hollow cavity of PdCu-H retains intermediate species. Linear sweep voltammetry (LSV) curves further indicate that this confinement promotes the 8-electron pathway toward NH3 formation while suppressing the competing HER (Figure 9e). As a result, the hollow architecture enabled selective NH3 synthesis at an exceptionally low overpotential of −0.30 V vs. RHE, which is attributed to the microscopic confinement of reactive nitrogen intermediates (*NO3, *NO2, *NH, etc.) within the hollow interior (Figure 9f). These results indicate that the hollow nanostructure simultaneously maximizes the exposure of catalytically active sites and shortens reactant diffusion pathways, thereby enhancing both electron-transfer kinetics and mass-transport efficiency.
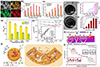 |
Figure 9 (a) STEM EDS mapping images of PdCu-H nanoparticles. (b, c) The |


The yolk-shell Co-based composite oxide also represents a significant advancement in hollow nanostructure design (Figure 9g, h) [33]. In the yolk-shell architecture, reduction-induced R-Co3O4 forms oxygen vacancy-rich Co3O4 and CoO phases. The R-Co3O4 catalyst achieves nearly 100%  at −0.05 V vs. RHE, along with a maximum NH3 production rate of 7.25 mg h−1 mgcat−1 (Figure 9i, j). X-ray photoelectron spectroscopy (XPS) analysis indicates that the hollow structure with oxygen-vacancy-enriched surfaces increases the proportion of Co2+ species and enhances the density of active sites. The absolute ECSA was not independently quantified, and the comparison is based on relative Cdl values. The double-layer capacitance (Cdl) was measured as an electrochemical proxy for surface area. R-Co3O4 exhibited a higher Cdl value (0.45 mF cm−2) compared with pristine Co3O4 (0.28 mF cm−2), suggesting an increased electrochemically accessible surface area in the hollow architecture. Moreover, density functional theory (DFT) calculations were performed to elucidate the structure-property relationship on Co3O4 and R-Co3O4 surfaces (Figure 9k, l), revealing that R-Co3O4 exhibits more favorable *NO2 intermediate reduction than pristine Co3O4. These results demonstrate that the key advantage of the yolk-shell structure extends beyond enhanced active-site exposure to the formation of binuclear Co2+ active sites, which optimize nitrate accessibility and accelerate intermediate reduction kinetics.
Meanwhile, a hollow, square-shaped Ni-doped copper oxide catalyst (Ni-CuO) exhibits pronounced synergistic effects arising from the combination of heteroatom doping and hollow architecture (Figure 10a) [34]. With 5% Ni incorporation, Ni-CuO achieved an  of 95.26% at –0.8 V vs. RHE, together with an NH3 yield rate of 0.94 mmol h−1 cm−2 (Figure 10b, c). To verify the role of Ni doping and the hollow structure in NO3RR, 5,5-dimethyl-1-pyrroline N-oxide (DMPO)-based electron paramagnetic resonance (EPR) was used to track *H species. Ni-CuO generated stronger DMPO-H signals than CuO in NO3− free electrolyte, indicating enhanced *H production. In the presence of NO3−, DMPO-H signals decreased due to *H consumption. Notably, Ni-CuO exhibited weaker signals than CuO, indicating that the hollow structure facilitates more efficient hydrogenation of *NOx intermediates, thereby promoting NO3RR activity (Figure 10d, e). Mechanistically, Ni incorporation could promote the generation of active hydrogen species (*H), thereby facilitating the hydrogenation of *NO and *NOH intermediates. In parallel, the hollow structure shortened the diffusion path of reactants through the shell and enhanced mass transport to the internal active sites (Figure 10f).
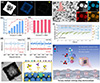 |
Figure 10 (a) HAADF-STEM, and elemental mapping images of the hollow square Ni-CuO. (b) NH3 yield rate and |

The hollow PdCuCo ternary medium-entropy alloy catalyst (HPdCuCo/RGO) demonstrates an advanced strategy for constructing a complete tandem catalytic system within a confined cavity (Figure 10g, h) [35]. This catalyst achieved nearly 100% NH3 Faradaic efficiency with an NH3 yield of 36 mg h−1 mgcat−1 at –0.5 V (vs. RHE) and further improved to 106 mg h−1 mgcat−1 at −0.9 V (Figure 10i). The proposed tandem mechanism involves Cu catalyzing the conversion of *NO3 to *NO2 through strong nitrate adsorption, Co facilitating the subsequent reduction of *NO2 to NH3, and Pd promoting water dissociation to supply protons (Figure 10j). This work indicates that the intrinsic advantages of hollow structures, including extended intermediate residence time and short diffusion length, enable well-defined tandem electrocatalysis within a single nanoreactor.
Overall, these studies demonstrated that hollow nanostructures enable deliberate control over reaction pathways by regulating the local concentration and residence time of key intermediates at catalytic interfaces. Across CO2RR and NO3RR, nano-structural parameters such as cavity size, shell thickness, pore geometry, and aperture dimensions emerge as quantitative design variables that govern intermediate accumulation, collision frequency, and ultimately product selectivity, including C2+ formation from CO2RR and selective NH3 production from NO3RR. Beyond simple cavity confinement, microscopic control over intermediate populations has been further extended through heteroatom incorporation, binuclear site optimization, and the construction of tandem catalytic systems, in which confined cavities facilitate coordinated reaction sequences and proton delivery. The progression from basic hollow architectures to parameter-driven cavity design and multi-functional nanoreactors reflects the maturation of the field toward rational catalyst architectures in which structural confinement is exploited not merely to enhance activity, but to precisely engineer intermediate populations and reaction pathways. In addition to geometric confinement, interfacial properties such as surface wettability may also influence intermediate enrichment by modulating gas-liquid transport within hollow architectures [36,37]. Together with the cavity-structure strategies discussed above, such interfacial effects could modulate CO2 accessibility in CO2RR or intermediate residence time in liquid-phase NO3RR, providing a complementary perspective on cavity-regulated electrocatalysis.
FUTURE PERSPECTIVES
At the level of reactant and product transport, hollow architectures introduce confined diffusion pathways and hierarchical porosity that modulate mass transport near catalytic sites, bridging macroscopic transport design principles established in gas diffusion layers with nanoscale catalyst architectures. At a deeper level, hollow cavities enable control over the local population and residence time of key reaction intermediates, as exemplified in CO2 reduction and nitrate reduction reactions. Through spatial confinement, hollow structures amplify intermediate concentrations, enhance effective collision frequencies, and enable reaction pathways that are kinetically unfavorable on open surfaces. Structural parameters such as cavity size, shell thickness, pore geometry, and aperture dimensions thus emerge as quantitative design variables governing pathway selection and product selectivity. In parallel, theoretical and computational approaches that integrate mass transport, reaction kinetics, and confinement effects across multiple length scales will play a critical role in guiding rational architectural design (Figure 11).
Beyond activity and selectivity enhancement, confinement-induced effects may also present important opportunities for improving catalyst durability and stability. Spatial confinement within hollow cavities can stabilize active species, suppress catalyst dissolution, and mitigate structural degradation under harsh electrochemical conditions. Restricted diffusion may further reduce the loss of soluble intermediates or metal species, while local variations in pH, ion distribution, and solvent accessibility inside confined spaces can subtly influence reaction energetics and long-term operational stability. These effects, although often treated as secondary, are expected to become increasingly important in practical electrocatalytic systems operating at high current densities. Also, conventional structure modeling, data-driven, and AI-assisted approaches are expected to play an increasingly important role in navigating the high-dimensional design space of hollow architectures [38–41]. Machine learning models trained on experimental and computational datasets may enable accelerated identification of optimal cavity geometries, shell structures, and compositional motifs that jointly regulate transport, intermediate populations, and stability. Such approaches hold promise for uncovering non-intuitive structure–function relationships that are difficult to access through trial-and-error experimentation alone.
Recent efforts have sought to probe the concentration of intermediate species within hollow nanocatalysts, providing mechanistic support for their enhanced catalytic performance. However, at the current stage, such insights are still derived from computational simulations such as FEA/FES and therefore remain indirect, underscoring the need for experimental tools capable of providing direct evidence. Surface-enhanced infrared absorption spectroscopy (SEIRAS) offers a viable route to monitor intermediates, yet IR-based detection can be limited by the selection rules and by a finite probing depth, which may hinder a complete assessment of cavity-confined effects in hollow structures [42,43]. Owing to the intrinsic near-field effect of SEIRAS, in which the enhancement decays exponentially within ~5 nm from the metal surface, it can provide strong interfacial sensitivity, but the enhanced signal predominantly originates from species within a few nanometers of the surface, which can underrepresent gradients extending into the cavity interior of hollow architectures. While this depth constraint cannot be fully eliminated, several developments have been proposed, such as improved ATR-SEIRAS configurations using attenuated total reflection (ATR) crystals with optimized cell designs to improve interfacial sensitivity [43]. In addition, operando Raman spectroscopy can serve as a complementary tool for monitoring surface intermediates and catalyst structural dynamics during electrocatalysis, by providing complementary vibrational information arising from different selection rules compared with infrared spectroscopy [25]. Moreover, differential electrochemical mass spectrometry (DEMS) enables real-time detection of reaction products, allowing direct correlation between surface intermediates and product formation pathways. Combining these operando spectroscopic techniques, such as ATR-SEIRAS, Raman spectroscopy, and DEMS with hollow catalyst systems, may provide experimentally accessible pathways for directly probing intermediate distributions and microenvironment effects within confined cavities.
Despite these advances, most currently available operando techniques primarily provide averaged spectroscopic information over the catalyst surface, making it difficult to directly resolve spatial heterogeneities within hollow architectures. In this regard, scanning electrochemical microscopy (SECM) is also a powerful approach to detect local reactivity and intermediate but achieving robust spatial resolution within confined cavities remains challenging [44–46]. In practical SECM measurements, the reliably observable spatial resolution is typically limited to the order of tens of nanometers (20–100 nm), even though nanometer-scale tip-substrate gaps can be achieved under specialized configurations. Accordingly, considerable efforts have focused on coupling SECM with multimodal scanning microscopy (SPM) platforms, such as atomic force microscopy (AFM) and scanning ion conductance microscopy (SICM), to improve feature discernibility. However, diffusional broadening intrinsic to SECM can still limit image fidelity. In this context, AI-assisted image processing can offer a powerful complementary method to enhance image quality. In addition, operando catalyst dissolution analysis (e.g., online inductively coupled plasma mass spectrometry, ICP-MS) could further quantify confinement-related suppression of metal dissolution under harsh conditions, linking microenvironment control to long-term durability. Collectively, these considerations emphasize the necessity of developing high-resolution operando characterization methods that can directly quantify intermediate distributions during electrochemical reactions in hollow architectures.
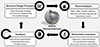 |
Figure 11 Closed-loop roadmap for hollow nanoarchitectures, illustrating structural design principles, electrocatalytic applications, mechanistic evaluation, and data-driven feedback for rational optimization. |
CONCLUSIONS
This review has summarized recent advances in hollow nanostructured catalysts from the perspective of local concentration regulation at catalytic interfaces. Hollow architectures were long valued for surface area maximization and intrinsic activity enhancement through structural and compositional tuning. More recent studies, however, have revealed that hollow cavities play an active role in shaping local reaction environments by regulating the transport and concentration of reactants, products, and reaction intermediates. In this context, hollow nanostructures emerge not merely as high-surface-area motifs, but as architectural platforms capable of directly influencing reaction kinetics, selectivity, and stability. Extending confinement-based design strategies to other complex electrochemical transformations, multistep catalytic cascades, and coupled electrochemical–chemical processes may open new avenues for achieving simultaneously high activity, selectivity, and durability. Future advances in hollow catalyst design will rely on the integrated control of transport, intermediate populations, confinement-induced stability effects, and data-driven design strategies, positioning architectural confinement as a central principle for next-generation electrocatalysts.
Funding
This work was supported by the National Research Foundation of Korea (RS-2023-00256106, RS-2024-00466554 and RS-2022-NR072264).
Conflict of interest
The authors declare no conflict of interest.
References
- Park J, Kwon T, Kim J, et al. Hollow nanoparticles as emerging electrocatalysts for renewable energy conversion reactions. Chem Soc Rev 2018; 47: 8173-8202. [Article] [Google Scholar]
- Mahmoud MA, Saira F, El-Sayed MA. Experimental evidence for the nanocage effect in catalysis with hollow nanoparticles. Nano Lett 2010; 10: 3764-3769. [Article] [Google Scholar]
- Skrabalak SE, Chen J, Sun Y, et al. Gold nanocages: Synthesis, properties, and applications. Acc Chem Res 2008; 41: 1587-1595. [Article] [Google Scholar]
- Lu X, Au L, McLellan J, et al. Fabrication of cubic nanocages and nanoframes by dealloying Au/Ag alloy nanoboxes with an aqueous etchant based on Fe(NO3)3 or NH4OH. Nano Lett 2007; 7: 1764-1769. [Article] [Google Scholar]
- Park J, Kim J, Yang Y, et al. RhCu 3D nanoframe as a highly active electrocatalyst for oxygen evolution reaction under alkaline condition. Adv Sci 2016; 3: 1500252. [Article] [Google Scholar]
- Kan C. Hollow and open nanostructures with enhanced activity. In: Can C (ed). Plasmonic Metal Nanostructures: Preparation, Characterization, and Applications. New Jersey: Wiley, 2024, 267–303. [Google Scholar]
- Xiao W, Lei W, Gong M, et al. Recent advances of structurally ordered intermetallic nanoparticles for electrocatalysis. ACS Catal 2018; 8: 3237-3256. [Article] [Google Scholar]
- Xue C, Zhou X, Li X, et al. Rational synthesis and regulation of hollow structural materials for electrocatalytic nitrogen reduction reaction. Adv Sci 2021; 9: 2104183. [Article] [Google Scholar]
- Pang F, Wang Z, Zhang K, et al. Bimodal nanoporous Pd3Cu1 alloy with restrained hydrogen evolution for stable and high yield electrochemical nitrogen reduction. Nano Energy 2019; 58: 834-841. [Article] [Google Scholar]
- Yang M, Zhang CH, Li NW, et al. Design and synthesis of hollow nanostructures for electrochemical water splitting. Adv Sci 2022; 9: 2105135. [Article] [Google Scholar]
- Kempler PA, Coridan RH, Luo L. Gas evolution in water electrolysis. Chem Rev 2024; 124: 10964-11007. [Article] [Google Scholar]
- Weng CC, Lv XW, Ren JT, et al. Engineering gas-solid-liquid triple-phase interfaces for electrochemical energy conversion reactions. Electrochem Energy Rev 2022; 5: 19. [Article] [Google Scholar]
- Zhang T, Meng L, Chen C, et al. Similarities and differences between gas diffusion layers used in proton exchange membrane fuel cell and water electrolysis for material and mass transport. Adv Sci 2024; 11: 2309440. [Article] [Google Scholar]
- Wang CR, Stansberry JM, Mukundan R, et al. Proton exchange membrane (PEM) water electrolysis: Cell-level considerations for gigawatt-scale deployment. Chem Rev 2025; 125: 1257-1302. [Article] [Google Scholar]
- Yuan C, Yin H, Li J, et al. Light-induced CoOx surface reconstruction in hollow heterostructure for durable photocatalytic seawater splitting. Nat Commun 2025; 16: 6607. [Article] [Google Scholar]
- Kim J, Kwon T, Lee J, et al. Ultrahigh electrode performance of low-loaded iridium jagged nanotubes for water electrolysis applications. Adv Energy Mater 2024; 14: 2400999. [Article] [Google Scholar]
- Hou M, Zheng L, Zhao D, et al. Microenvironment reconstitution of highly active Ni single atoms on oxygen-incorporated Mo2C for water splitting. Nat Commun 2024; 15: 1342. [Article] [Google Scholar]
- Hou P, Li D, Yang N, et al. Delicate control on the shell structure of hollow spheres enables tunable mass transport in water splitting. Angew Chem Int Ed 2021; 60: 6926-6931. [Article] [Google Scholar]
- Zhao H, Ma K, Gao S, et al. Advances in understanding and manipulating electrode wettability for electrocatalytic performance enhancement. Mater Today Catal 2025; 9: 100101. [Article] [Google Scholar]
- Shi R, Shang L, Zhou C, et al. Interfacial wettability and mass transfer characterizations for gas-liquid-solid triple-phase catalysis. Exploration 2022; 2: 20210046. [Article] [Google Scholar]
- Liu M, Jiang Y, Cao Z, et al. Accelerating H* desorption of hollow Mo2C nanoreactor via in-situ grown carbon dots for electrocatalytic hydrogen evolution. J Energy Chem 2024; 96: 464-471. [Article] [Google Scholar]
- Chong B, Xia M, Lv Y, et al. Hierarchical phosphorus-oxygen incorporated cobalt sulfide hollow micro/nano-reactor for highly-efficient electrocatalytic overall water splitting. Chem Eng J 2023; 465: 142853. [Article] [Google Scholar]
- Liu X, Gong L, Wang L, et al. Enabling ultrafine Ru nanoparticles with tunable electronic structures via a double-shell hollow interlayer confinement strategy toward enhanced hydrogen evolution reaction performance. Nano Lett 2023; 24: 592-600. [Article] [Google Scholar]
- Heenen HH, Pillai HS, Reuter K, et al. Exploring mesoscopic mass transport effects on electrocatalytic selectivity. Nat Catal 2024; 7: 847-854. [Article] [Google Scholar]
- Zhan C, Dattila F, Rettenmaier C, et al. Key intermediates and Cu active sites for CO2 electroreduction to ethylene and ethanol. Nat Energy 2024; 9: 1485-1496. [Article] [Google Scholar]
- Ren B, Zhang X, Yang L, et al. Localized mass transport channels for electro-upgrade of dilute CO2 toward high-yield C2+ products. Nat Commun 2025; 16: 8383. [Article] [Google Scholar]
- Zhao Q, Martirez JMP, Carter EA. Charting C–C coupling pathways in electrochemical CO2 reduction on Cu(111) using embedded correlated wavefunction theory. Proc Natl Acad Sci USA 2022; 119: e2202931119. [Article] [Google Scholar]
- Fu XX, Guo H, Si DH, et al. Hydrogen-bond mediated electrocatalytic nitrate reduction to ammonia over metal-organic frameworks with industrial current density. Chem Sci 2025; 16: 13503-13513. [Article] [Google Scholar]
- Liu LX, Cai Y, Du H, et al. Enriching the local concentration of CO intermediates on Cu cavities for the electrocatalytic reduction of CO2 to C2+ products. ACS Appl Mater Interfaces 2023; 15: 16673-16679. [Article] [Google Scholar]
- Dutta N, Giri B, Riyaz M, et al. Confining reaction intermediates in oxide-derived hollow Cu-Zn bimetallic catalyst facilitates selective formation of C2+ alcohols from electrochemical carbon dioxide reduction. Angew Chem Int Ed 2026; 65: e23150. [Article] [Google Scholar]
- Zhang Z, Guo H, Li S, et al. Cavity-confined Au@Cu2O yolk-shell nanoreactors enable switchable CH4/C2H4 selectivity. Nat Commun 2025; 16: 7559. [Article] [Google Scholar]
- Min X, Liu B. Microenvironment engineering to promote selective ammonia electrosynthesis from nitrate over a PdCu hollow catalyst. Small 2023; 19: 2300794. [Article] [Google Scholar]
- Lu D, Liu T, Han J, et al. Yolk-shell composite oxides with binuclear Co(II) sites toward low-overpotential nitrate reduction to ammonia. Chem Eng J 2023; 477: 146896. [Article] [Google Scholar]
- Li Y, Wei J, Lin H, et al. Hollow square Ni-doped copper oxide catalyst boosting electrocatalytic nitrate reduction. ACS Catal 2025; 15: 1672-1683. [Article] [Google Scholar]
- Yan R, Yin H, Zuo XF, et al. Hollow PdCuCo medium-entropy alloy on reduced graphene oxide with proton-mediator boosted tandem catalysis for high-performance nitrate reduction. Appl Catal B-Environ Energy 2025; 361: 124609. [Article] [Google Scholar]
- Lin Y, Wang T, Zhang L, et al. Tunable CO2 electroreduction to ethanol and ethylene with controllable interfacial wettability. Nat Commun 2023; 14: 3575. [Article] [Google Scholar]
- Liu Y, Zheng Y, Ren Y, et al. Selective nitrate electroreduction to ammonia on CNT electrodes with controllable interfacial wettability. Environ Sci Technol 2024; 58: 7228-7236. [Article] [Google Scholar]
- Tao H, Wu T, Aldeghi M, et al. Nanoparticle synthesis assisted by machine learning. Nat Rev Mater 2021; 6: 701-716. [Article] [Google Scholar]
- Pan F, Wu CC, Chen YL, et al. Machine learning ensures rapid and precise selection of gold sea-urchin-like nanoparticles for desired light-to-plasmon resonance. Nanoscale 2022; 14: 13532-13541. [Article] [Google Scholar]
- Jiang X, Zhao Y, Liu J, et al. Machine learning captures synthetic intuitions for hollow nanostructures. ACS Appl Nano Mater 2022; 5: 17095-17104. [Article] [Google Scholar]
- Zhao D, Guan Y, Wu Z, et al. Thermal stability and mechanical properties of hollow si nanowires from atomic modeling combined with a machine-learning prediction for application as Li-ion battery anodes. ACS Appl Nano Mater 2023; 6: 22241-22252. [Article] [Google Scholar]
- Ashimura S, Mori O, Konaka R, et al. In situ SEIRAS analysis of enhanced photocatalytic carrier transfer to a Pt cocatalyst induced by sacrificial reagents. Chem Commun 2025; 61: 6775-6778. [Article] [Google Scholar]
- Wang Y, Ding J, Su C, et al. Atr-seiras for single-atom electrocatalysis. Acc Chem Res 2025; 58: 2282-2295. [Article] [Google Scholar]
- Putnam ST, Santiago-Carboney A, Qian P, et al. Scanning electrochemical microscopy: An evolving toolbox for revealing the chemistry within electrochemical processes. Anal Chem 2025; 97: 8147-8181. [Article] [Google Scholar]
- Polcari D, Dauphin-Ducharme P, Mauzeroll J. Scanning electrochemical microscopy: A comprehensive review of experimental parameters from 1989 to 2015. Chem Rev 2016; 116: 13234-13278. [Article] [Google Scholar]
- Zhang X, Han C, Xu W. Imaging analysis of scanning electrochemical microscopy in energy catalysis. Chem Biomed Imag 2023; 1: 205-219. [Article] [Google Scholar]
All Figures
|
Figure 1 (a) Schematic illustration summarizing the conceptual evolution of hollow electrocatalyst, from surface area maximization (phase 1), to mass transport engineering (phase 2), and further to intermediate densification (phase 3). (b) Schematic overview of hollow nanoarchitecture design, illustrating representative structural models and key parameters such as shell thickness, shell multiplicity, and cavity size. |
| In the text | |
|
Figure 2 (a) Schematic illustration of the fabrication process of the NiSA–O/Mo2C electrocatalyst. (b, c) High-resolution transmission electron microscopy (HR-TEM) images of NiSA–O/Mo2C. Insets: selected area electron diffraction (SAED) patterns. (d) Elemental mapping of Mo, Ni, O and C for an individual NiSA–O/Mo2C nanosphere (inset of (c)), respectively. (e, f) Polarization curves and Tafel plots for NiSA–O/Mo2C, Ni1.5–O/Mo2C, Ni4.5–O/Mo2C, and pure O/Mo2C, commercial IrO2 for OER (loading amount 0.74 mg cm−2). (g, h) Polarization curve and Tafel plots for NiSA–O/Mo2C, Ni1.5–O/Mo2C, Ni4.5–O/Mo2C and pure O/Mo2C, 20% Pt/C for HER (loading amount 0.7 mg cm−2). (i) The Nyquist plots of O/Mo2C and NiSA–O/Mo2C, Ni1.5–O/Mo2C, Ni4.5–O/Mo2C. Inset is the long-term durability of overall water splitting at a current density of 10 mA cm−2. (j) Polarization curves of NiSA–O/Mo2C||NiSA–O/Mo2C and Pt/C||IrO2 couples for overall water splitting in 1.0 M KOH (loading amount 0.74 mg cm−2). Adapted from Ref. [17]. Copyright 2024, Springer Nature. |
| In the text | |
|
Figure 3 (a–d) Low- and high-magnification (inset) TEM images of Co3O4-HoMSs and samples after phosphorization reaction for 2 h (B-CoP-HoMSs), 4 h (D-CoP-HoMSs), and 8 h (CoP-HoMSs). The scale bars of inset images are 50 nm. (e, f) HER LSV and Tafel plots of HoMS samples before and after grinding and Pt/C, recorded at a scan rate of 5 mV s−1 in 1.0 M KOH electrolyte. (g, h) OER LSV and Tafel plots of HoMS samples before and after grinding and RuO2, recorded at a scan rate of 5 mV s−1 in 1.0 M KOH electrolyte. (i) EIS Nyquist plots of HoMS samples before and after grinding. (j) Water contact angle images of 2 μL liquid drops on B-CoP-HoMSs, D-CoP-HoMSs, and CoP-HoMSs, and bubble contact angle images of HoMSs under water. Adapted from Ref. [18]. Copyright 2021, Wiley-VCH GmbH. |
| In the text | |
|
Figure 4 (a, b) Scanning electron microscopy (SEM) and HR-TEM images of CD@Mo2C-3. (c, d) Elemental mapping of Mo and C for CD@Mo2C-3. (e, f) Polarization curves and corresponding Tafel slops of CD@Mo2C catalysts. (g) Nyquist plots at −1.17 V (vs. SCE). (h) A bar diagram of ECSA for the series of CD@Mo2C nanoreactors. (i–k) H+ concentration around Mo2C and CD@Mo2C nanoreactor. (l–n) H2 concentration around Mo2C and CD@Mo2C nanoreactor. (o–q) Surface pressure fields for Mo2C and CD@Mo2C nanoreactor. Adapted from Ref. [21]. Copyright 2024, Elsevier. |
| In the text | |
|
Figure 5 (a, b) SEM images of Co-OS sphere and Co-OSP sphere. (c) Elemental mapping images of Co, O, S, and P elements. (d) HR-TEM image. (e, f) OER polarization curves and corresponding Tafel slots. (g) The calculated electrochemical Cdl plot. (h, i) HER polarization curves and corresponding Tafel slots. (j) EIS plot. Velocity field distributions of different morphology models for (k) solid sphere, (l) hollow sphere, and (m) ball-in-ball structural sphere. (n) Flow velocity variation along the middle position of ball-in-ball model. Adapted from Ref. [22]. Copyright 2023, Elsevier. |
| In the text | |
|
Figure 6 (a) Schematic illustration of the Ru-SSC, Ru-DSC-I, and Ru-DSC-E. (b–d) TEM, HR-TEM, and HAADF-HRTEM images with enlarged selected areas and corresponding elemental mappings of Ru-DSC-I. (e, f) HER polarization curves and corresponding Tafel slots. (g) The EIS curves and corresponding equivalent circuit model for the Ru-SSC, Ru-DSC-I, and Ru-DSC-E at open-circuit voltages. (h) ECSA values of catalysts. (i, j) The velocity fields and streamline distributions of single-shell and double-shell models. (k, l) Corresponding velocity plots from A to B. (m, n) The 2D mapping images of the vortex fields in the single-shell and double-shell models. Adapted from Ref. [23]. Copyright 2024, American Chemical Society. |
| In the text | |
|
Figure 7 (a, b) Structural characterization of the cavity Cu2O precursor: SEM and TEM images. (c) C2+ partial current densities. (d) Stability test of cavity Cu throughout 12 h of CO2 electrolysis at 200 mA cm–2. Calculated concentration and distribution of species: CO2 (e), C1 (f), C2 (g), and C3 (h) concentrations on the cavity structure. The units of the CO2, C1, C2, and C3 concentrations were all mM in the color scale, and the scale bars are 100 nm. Adapted from Ref. [29]. Copyright 2023, American Chemical Society. (i) SEM-energy dispersive X-ray spectroscopy (EDS) mapping showing hollow structure and homogenous distribution of Cu and Zn. (j) Change of FE of C2+ product at different Cu/Zn atomic composition. (k) Schematic illustration of Cu6Zn-h catalyst giving C2+ product. Simulated concentration and flux distribution of (l) CO in Cu6Zn-h and Cu6Zn-b, (m) simulated concentration of OH− in Cu6Zn-h and Cu6Zn-b (color scale, concentration in mM). Adapted from Ref. [30]. Copyright 2025, Wiley-VCH GmbH. |
| In the text | |
|
Figure 8 (a) EDX mapping images and TEM Au@Cu2O-L NRs. (b) EDX mapping images and TEM Au@Cu2O-M NRs. (c) EDX mapping images and TEM Au@Cu2O-S NRs. FEs of various reduction products at different potentials tested in a flow-cell with 1.0 M KOH electrolyte for (d) Au@Cu2O-L-10, (e) Au@Cu2O-M-10, and (f) Au@Cu2O-S-10 NRs, respectively. (g, h) Computed concentration distribution of CO2 and CO species of Au@Cu2O-L. (i, j) Computed concentration distribution of CO2 and CO species of Au@Cu2O-M. (k, l) Computed concentration distribution of CO2 and CO species of Au@Cu2O-S. (m) Schematic diagram of the cavity-confined catalytic mechanism of Au@Cu2O-x NRs. Adapted from Ref. [31]. Copyright 2025, Springer Nature. |
| In the text | |
|
Figure 9 (a) STEM EDS mapping images of PdCu-H nanoparticles. (b, c) The |
| In the text | |
|
Figure 10 (a) HAADF-STEM, and elemental mapping images of the hollow square Ni-CuO. (b) NH3 yield rate and |
| In the text | |
|
Figure 11 Closed-loop roadmap for hollow nanoarchitectures, illustrating structural design principles, electrocatalytic applications, mechanistic evaluation, and data-driven feedback for rational optimization. |
| In the text | |
Current usage metrics show cumulative count of Article Views (full-text article views including HTML views, PDF and ePub downloads, according to the available data) and Abstracts Views on Vision4Press platform.
Data correspond to usage on the plateform after 2015. The current usage metrics is available 48-96 hours after online publication and is updated daily on week days.
Initial download of the metrics may take a while.