Figure 4
Download original image
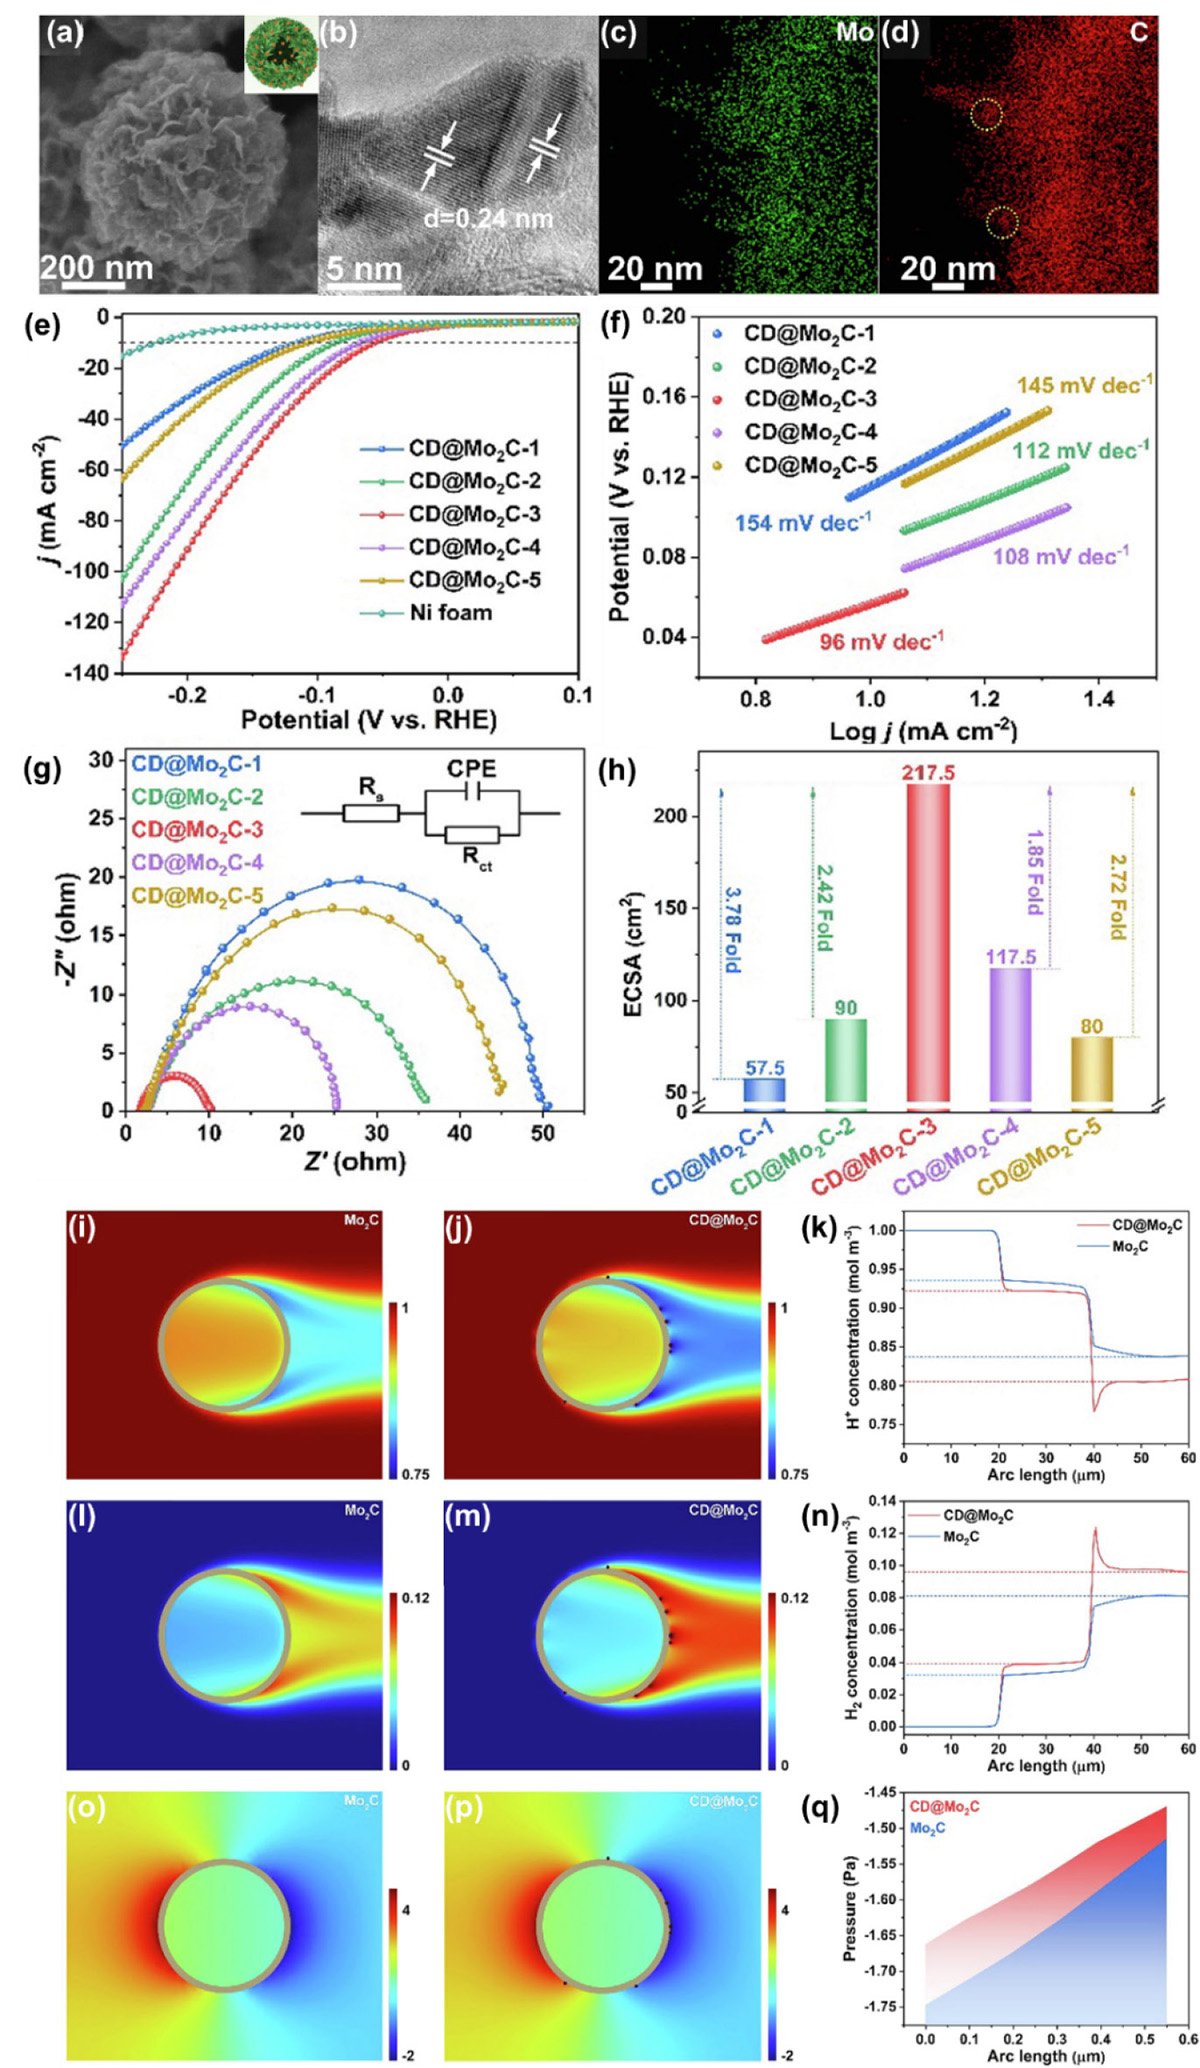
(a, b) Scanning electron microscopy (SEM) and HR-TEM images of CD@Mo2C-3. (c, d) Elemental mapping of Mo and C for CD@Mo2C-3. (e, f) Polarization curves and corresponding Tafel slops of CD@Mo2C catalysts. (g) Nyquist plots at −1.17 V (vs. SCE). (h) A bar diagram of ECSA for the series of CD@Mo2C nanoreactors. (i–k) H+ concentration around Mo2C and CD@Mo2C nanoreactor. (l–n) H2 concentration around Mo2C and CD@Mo2C nanoreactor. (o–q) Surface pressure fields for Mo2C and CD@Mo2C nanoreactor. Adapted from Ref. [21]. Copyright 2024, Elsevier.
Current usage metrics show cumulative count of Article Views (full-text article views including HTML views, PDF and ePub downloads, according to the available data) and Abstracts Views on Vision4Press platform.
Data correspond to usage on the plateform after 2015. The current usage metrics is available 48-96 hours after online publication and is updated daily on week days.
Initial download of the metrics may take a while.