Figure 6
Download original image
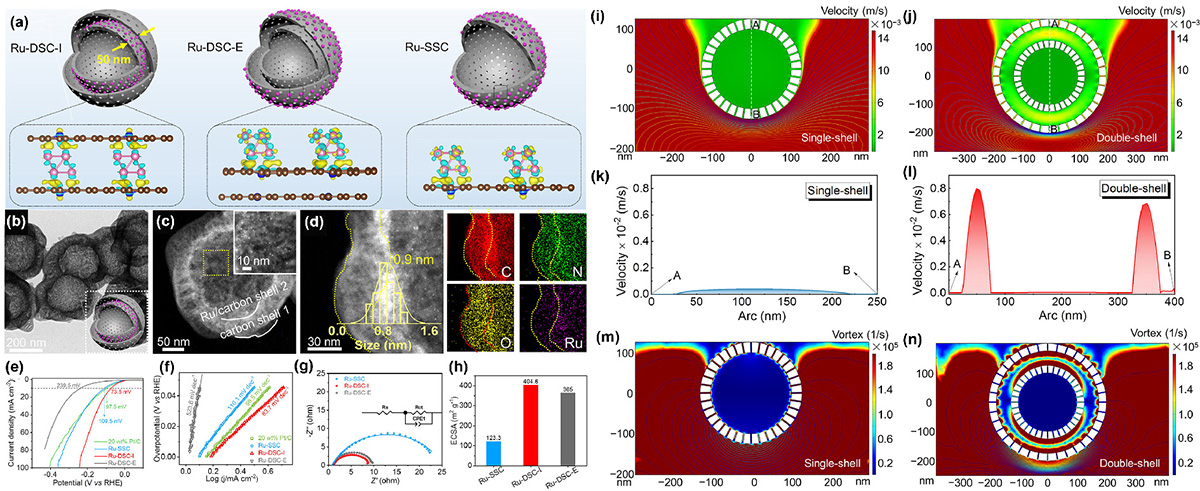
(a) Schematic illustration of the Ru-SSC, Ru-DSC-I, and Ru-DSC-E. (b–d) TEM, HR-TEM, and HAADF-HRTEM images with enlarged selected areas and corresponding elemental mappings of Ru-DSC-I. (e, f) HER polarization curves and corresponding Tafel slots. (g) The EIS curves and corresponding equivalent circuit model for the Ru-SSC, Ru-DSC-I, and Ru-DSC-E at open-circuit voltages. (h) ECSA values of catalysts. (i, j) The velocity fields and streamline distributions of single-shell and double-shell models. (k, l) Corresponding velocity plots from A to B. (m, n) The 2D mapping images of the vortex fields in the single-shell and double-shell models. Adapted from Ref. [23]. Copyright 2024, American Chemical Society.
Current usage metrics show cumulative count of Article Views (full-text article views including HTML views, PDF and ePub downloads, according to the available data) and Abstracts Views on Vision4Press platform.
Data correspond to usage on the plateform after 2015. The current usage metrics is available 48-96 hours after online publication and is updated daily on week days.
Initial download of the metrics may take a while.