Figure 8
Download original image
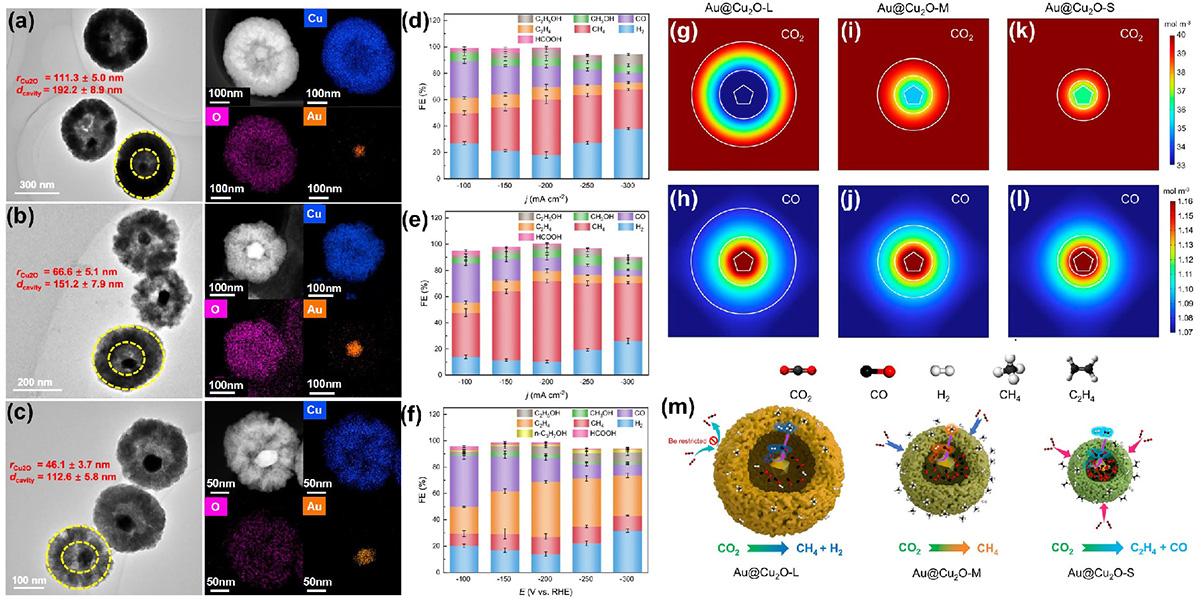
(a) EDX mapping images and TEM Au@Cu2O-L NRs. (b) EDX mapping images and TEM Au@Cu2O-M NRs. (c) EDX mapping images and TEM Au@Cu2O-S NRs. FEs of various reduction products at different potentials tested in a flow-cell with 1.0 M KOH electrolyte for (d) Au@Cu2O-L-10, (e) Au@Cu2O-M-10, and (f) Au@Cu2O-S-10 NRs, respectively. (g, h) Computed concentration distribution of CO2 and CO species of Au@Cu2O-L. (i, j) Computed concentration distribution of CO2 and CO species of Au@Cu2O-M. (k, l) Computed concentration distribution of CO2 and CO species of Au@Cu2O-S. (m) Schematic diagram of the cavity-confined catalytic mechanism of Au@Cu2O-x NRs. Adapted from Ref. [31]. Copyright 2025, Springer Nature.
Current usage metrics show cumulative count of Article Views (full-text article views including HTML views, PDF and ePub downloads, according to the available data) and Abstracts Views on Vision4Press platform.
Data correspond to usage on the plateform after 2015. The current usage metrics is available 48-96 hours after online publication and is updated daily on week days.
Initial download of the metrics may take a while.