Figure 7
Download original image
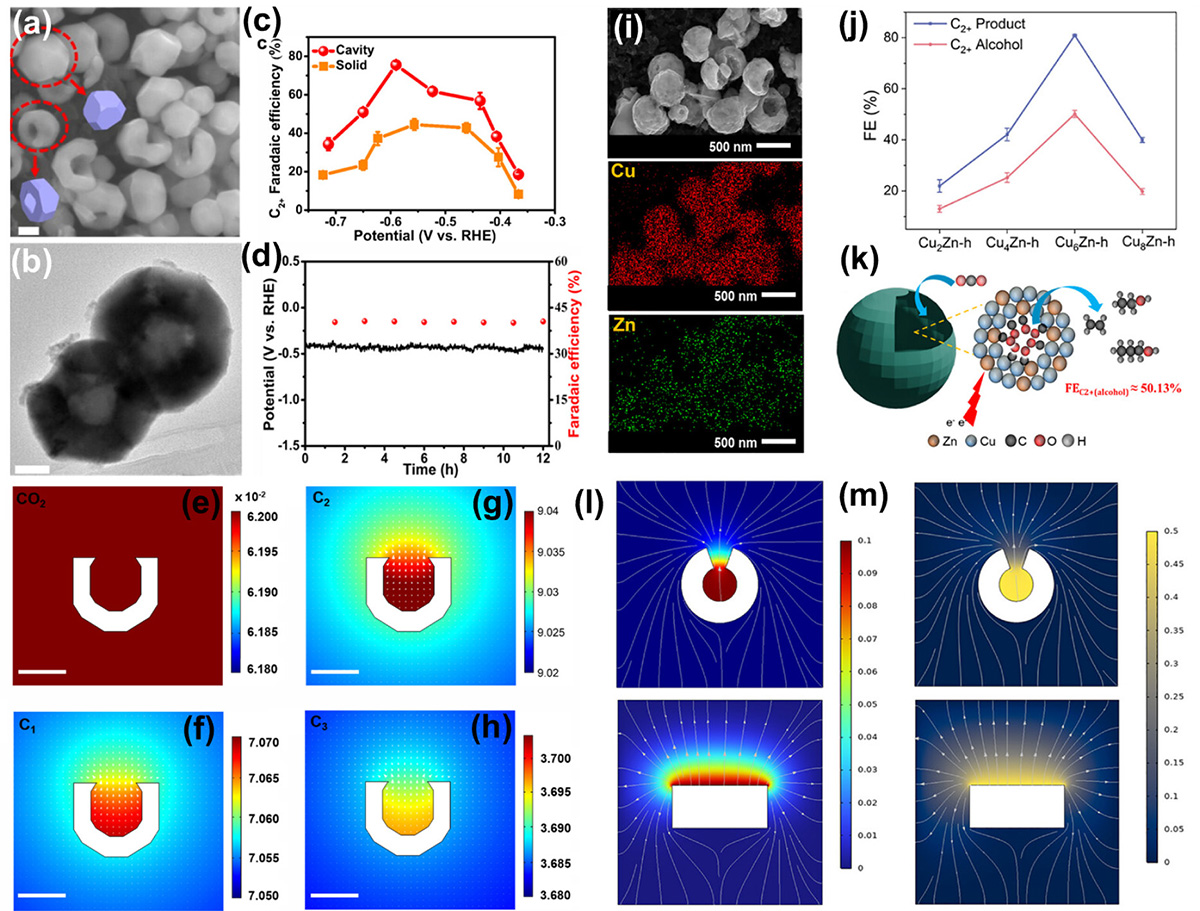
(a, b) Structural characterization of the cavity Cu2O precursor: SEM and TEM images. (c) C2+ partial current densities. (d) Stability test of cavity Cu throughout 12 h of CO2 electrolysis at 200 mA cm–2. Calculated concentration and distribution of species: CO2 (e), C1 (f), C2 (g), and C3 (h) concentrations on the cavity structure. The units of the CO2, C1, C2, and C3 concentrations were all mM in the color scale, and the scale bars are 100 nm. Adapted from Ref. [29]. Copyright 2023, American Chemical Society. (i) SEM-energy dispersive X-ray spectroscopy (EDS) mapping showing hollow structure and homogenous distribution of Cu and Zn. (j) Change of FE of C2+ product at different Cu/Zn atomic composition. (k) Schematic illustration of Cu6Zn-h catalyst giving C2+ product. Simulated concentration and flux distribution of (l) CO in Cu6Zn-h and Cu6Zn-b, (m) simulated concentration of OH− in Cu6Zn-h and Cu6Zn-b (color scale, concentration in mM). Adapted from Ref. [30]. Copyright 2025, Wiley-VCH GmbH.
Current usage metrics show cumulative count of Article Views (full-text article views including HTML views, PDF and ePub downloads, according to the available data) and Abstracts Views on Vision4Press platform.
Data correspond to usage on the plateform after 2015. The current usage metrics is available 48-96 hours after online publication and is updated daily on week days.
Initial download of the metrics may take a while.