Figure 3
Download original image
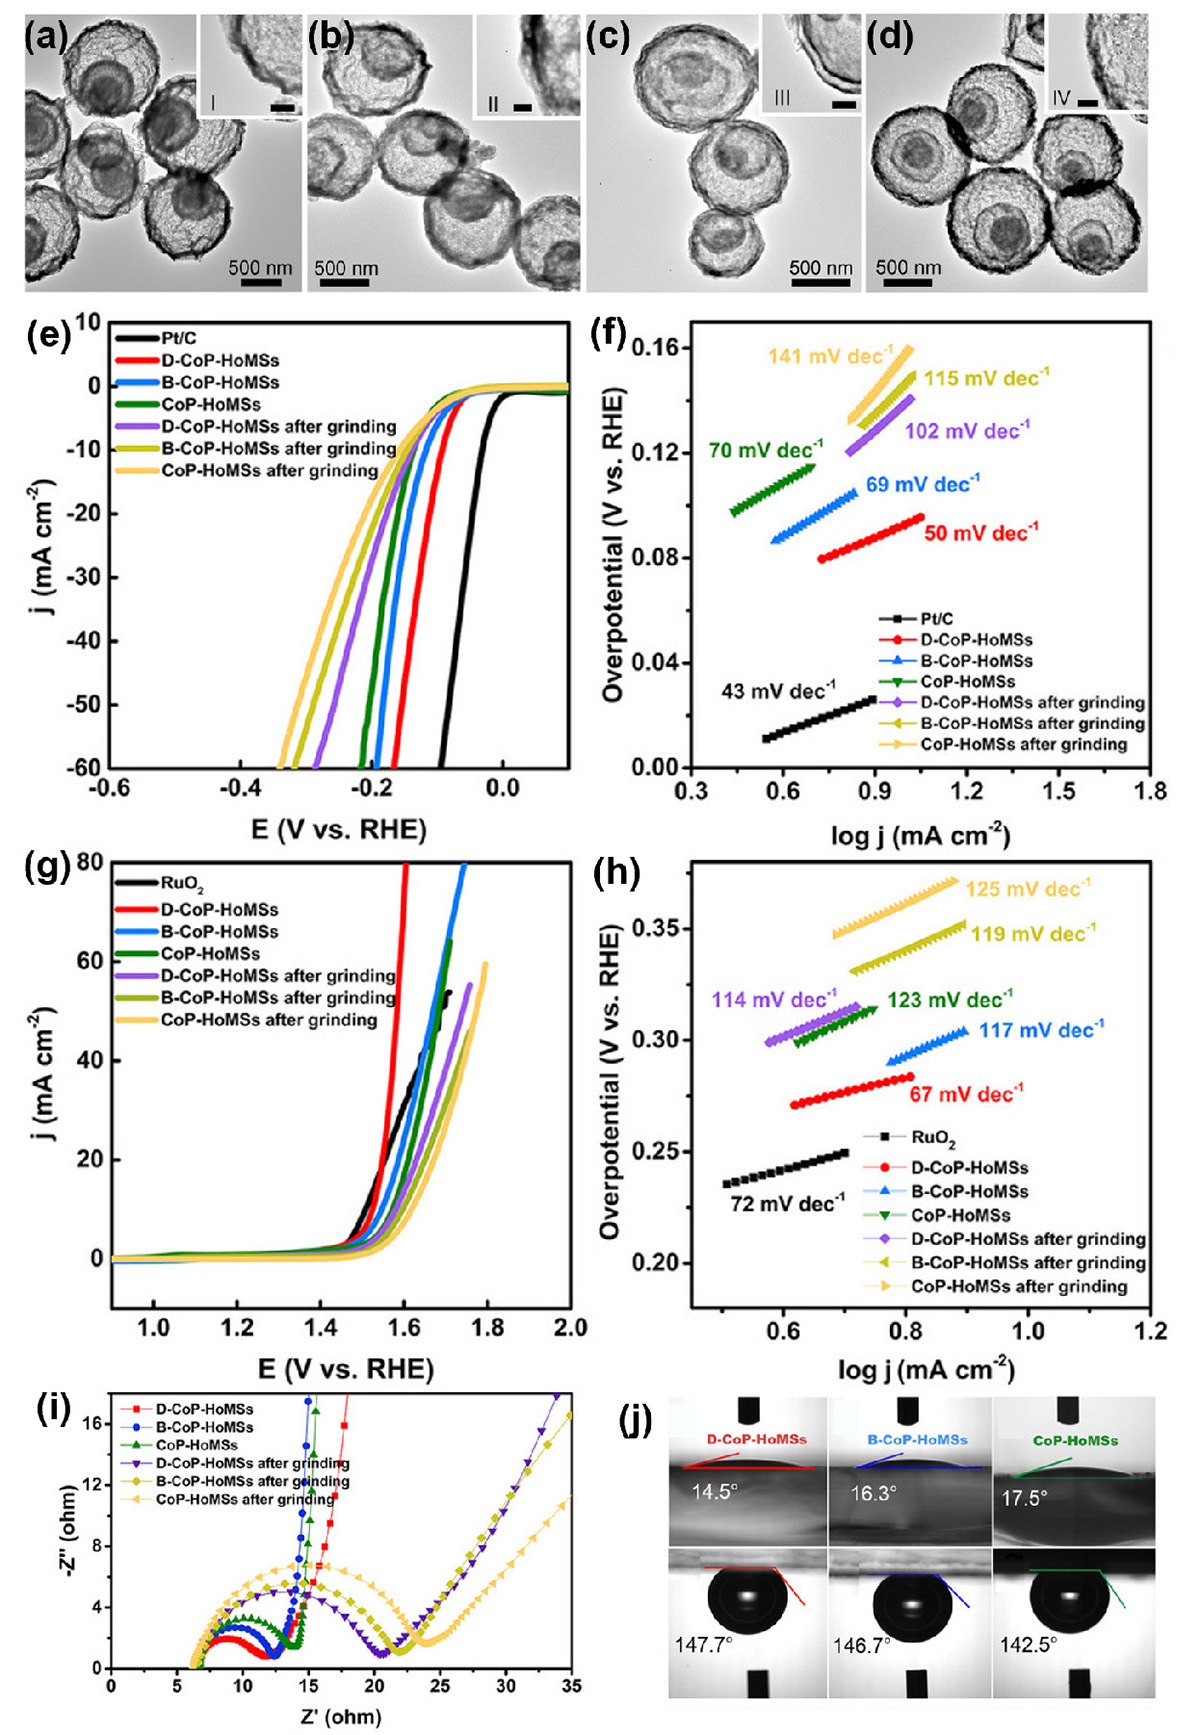
(a–d) Low- and high-magnification (inset) TEM images of Co3O4-HoMSs and samples after phosphorization reaction for 2 h (B-CoP-HoMSs), 4 h (D-CoP-HoMSs), and 8 h (CoP-HoMSs). The scale bars of inset images are 50 nm. (e, f) HER LSV and Tafel plots of HoMS samples before and after grinding and Pt/C, recorded at a scan rate of 5 mV s−1 in 1.0 M KOH electrolyte. (g, h) OER LSV and Tafel plots of HoMS samples before and after grinding and RuO2, recorded at a scan rate of 5 mV s−1 in 1.0 M KOH electrolyte. (i) EIS Nyquist plots of HoMS samples before and after grinding. (j) Water contact angle images of 2 μL liquid drops on B-CoP-HoMSs, D-CoP-HoMSs, and CoP-HoMSs, and bubble contact angle images of HoMSs under water. Adapted from Ref. [18]. Copyright 2021, Wiley-VCH GmbH.
Current usage metrics show cumulative count of Article Views (full-text article views including HTML views, PDF and ePub downloads, according to the available data) and Abstracts Views on Vision4Press platform.
Data correspond to usage on the plateform after 2015. The current usage metrics is available 48-96 hours after online publication and is updated daily on week days.
Initial download of the metrics may take a while.