Figure 9
Download original image
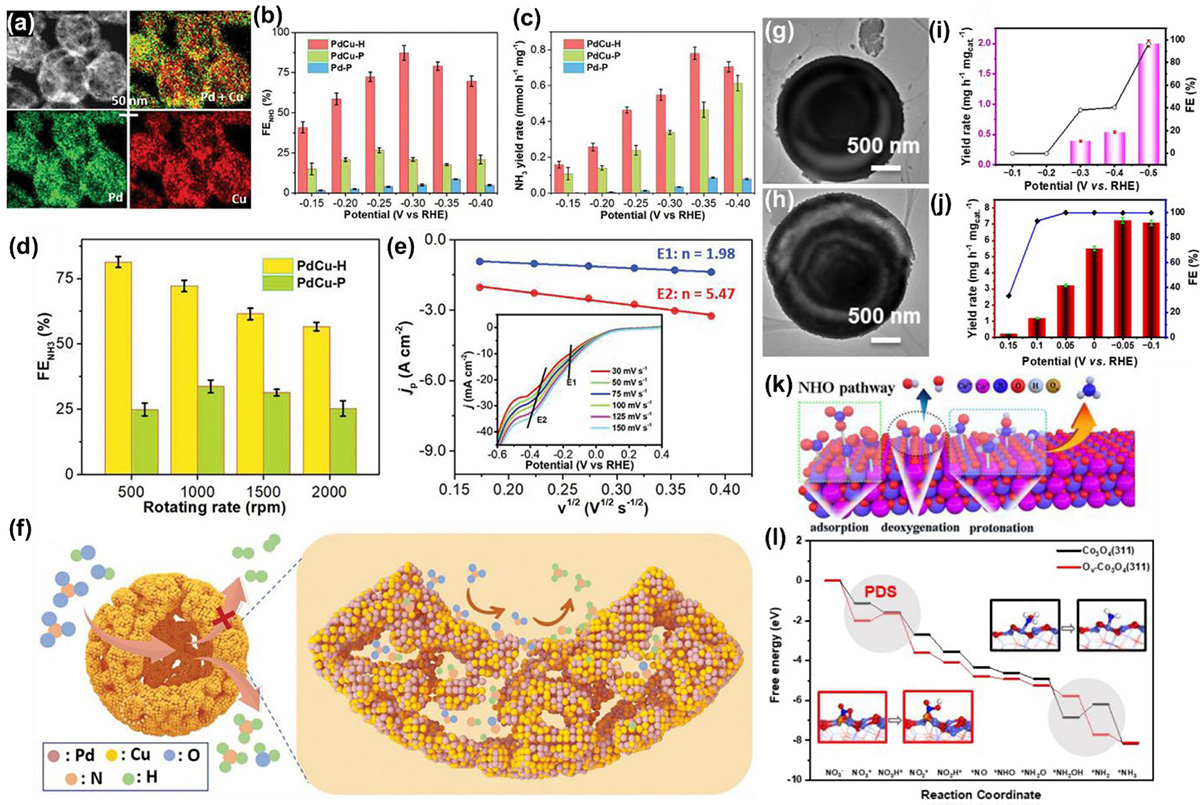
(a) STEM EDS mapping images of PdCu-H nanoparticles. (b, c) The ![]() values and NH3 yield rates of PdCu-H, PdCu-P, and commercial Pd-P, collected under different potentials. (d) The relationships between
values and NH3 yield rates of PdCu-H, PdCu-P, and commercial Pd-P, collected under different potentials. (d) The relationships between ![]() and rotation rates over PdCu-H, PdCu-P, and Pd-P. (e) LSV curves and summarized relationships between current densities and the square root of scan rates for the NO3−RR electrocatalysis over PdCu-H. (f) Schematic illustrations for selective NO3−RR electrocatalysis over PdCu-P. Adapted from Ref. [32]. Copyright 2023, Wiley-VCH GmbH. (g, h) TEM images of Co3O4 and R-Co3S4. (i) The NH4+ yield rate and FE on Co3O4 at varying potentials. (j) The corresponding NH4+ yield and FE at different potentials for R-Co3O4 catalyst in the electrolyte of 0.1 M KOH with 1000 ppm KNO3 for 1 h under different potentials. Error bars correspond to the standard deviations of three independent measurements. (k) Reaction pathway for nitrate reduction to ammonia on the R-Co3O4 catalyst. (l) Gibbs free energy diagrams at U = 0.0 V and atomic configurations of key adsorbed intermediates for NO3RR on the R-Co3O4 catalyst and Co3O4 catalyst, in which the light blue, red, white, and dark blue represent Co, O, H, and N, respectively. Adapted from Ref. [33]. Copyright 2023, Elsevier.
and rotation rates over PdCu-H, PdCu-P, and Pd-P. (e) LSV curves and summarized relationships between current densities and the square root of scan rates for the NO3−RR electrocatalysis over PdCu-H. (f) Schematic illustrations for selective NO3−RR electrocatalysis over PdCu-P. Adapted from Ref. [32]. Copyright 2023, Wiley-VCH GmbH. (g, h) TEM images of Co3O4 and R-Co3S4. (i) The NH4+ yield rate and FE on Co3O4 at varying potentials. (j) The corresponding NH4+ yield and FE at different potentials for R-Co3O4 catalyst in the electrolyte of 0.1 M KOH with 1000 ppm KNO3 for 1 h under different potentials. Error bars correspond to the standard deviations of three independent measurements. (k) Reaction pathway for nitrate reduction to ammonia on the R-Co3O4 catalyst. (l) Gibbs free energy diagrams at U = 0.0 V and atomic configurations of key adsorbed intermediates for NO3RR on the R-Co3O4 catalyst and Co3O4 catalyst, in which the light blue, red, white, and dark blue represent Co, O, H, and N, respectively. Adapted from Ref. [33]. Copyright 2023, Elsevier.
Current usage metrics show cumulative count of Article Views (full-text article views including HTML views, PDF and ePub downloads, according to the available data) and Abstracts Views on Vision4Press platform.
Data correspond to usage on the plateform after 2015. The current usage metrics is available 48-96 hours after online publication and is updated daily on week days.
Initial download of the metrics may take a while.