Figure 4
Download original image
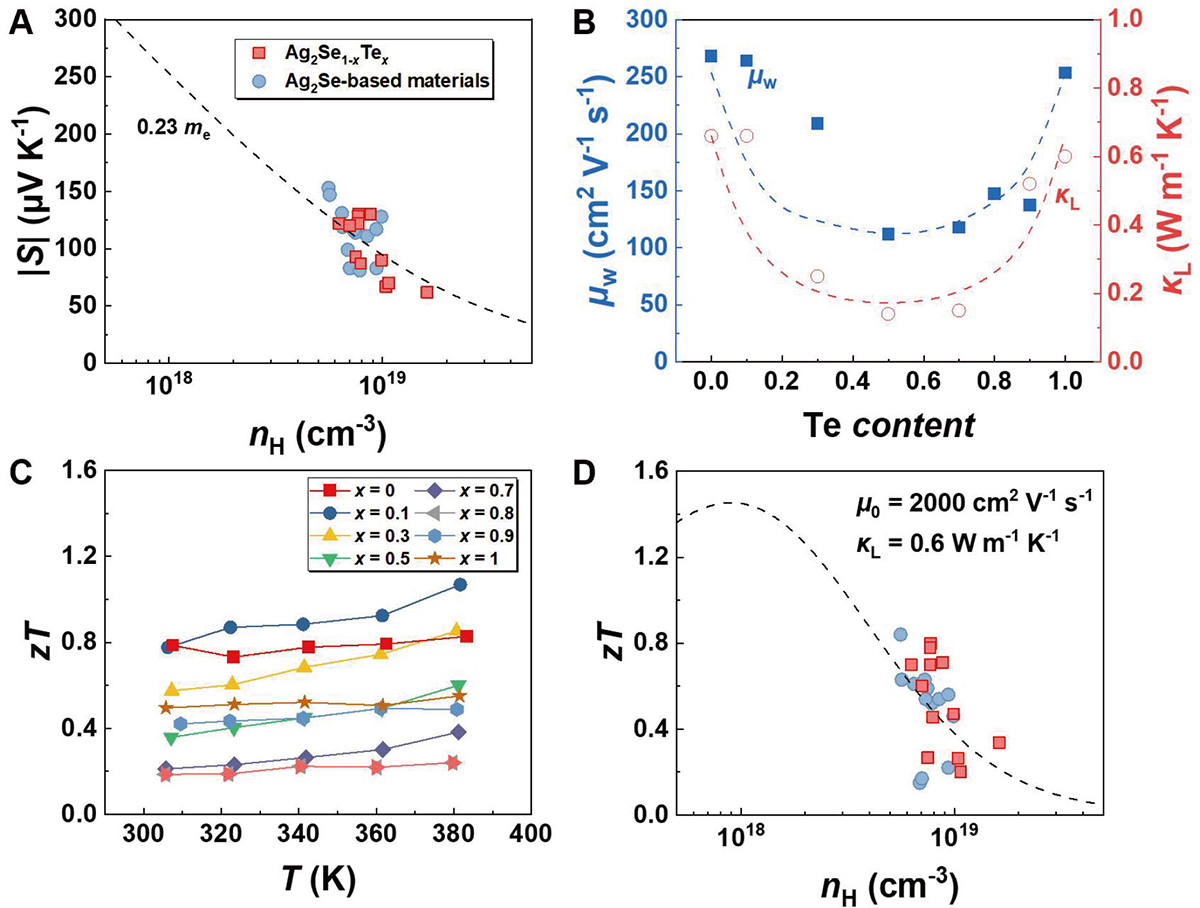
(A) Absolute Seebeck coefficient |S| versus carrier concentration nH for Ag2Se1–xTex materials at 300 K. Data of other Ag2Se-based materials are taken from Refs. [29,43]. The dashed line represents the calculated Pisarenko curve by the SPB model. (B) Relations of weighted mobility and lattice thermal conductivity with Te content; the dashed lines are calculated curves. (C) Temperature dependence of zT value for Ag2Se1–xTex samples with optimized Ag content. (D) zT value versus carrier concentration nH for Ag2Se1–xTex materials at 300 K. Data of other Ag2Se-based materials are taken from Refs. [29,43]. The dashed line represents the calculated Pisarenko curve by the SPB model.
Current usage metrics show cumulative count of Article Views (full-text article views including HTML views, PDF and ePub downloads, according to the available data) and Abstracts Views on Vision4Press platform.
Data correspond to usage on the plateform after 2015. The current usage metrics is available 48-96 hours after online publication and is updated daily on week days.
Initial download of the metrics may take a while.