| Issue |
Natl Sci Open
Volume 5, Number 2, 2026
|
|
|---|---|---|
| Article Number | 20250083 | |
| Number of page(s) | 12 | |
| Section | Materials Science | |
| DOI | https://doi.org/10.1360/nso/20250083 | |
| Published online | 18 January 2026 | |
RESEARCH ARTICLE
F/N co-doped carbon coating on graphite for high-rate, long-cycle-life lithium-ion batteries
1
Engineering Research Center of Advanced Semiconductor Technology and Application of Ministry of Education, National Key Laboratory of Power Semiconductor and Integration Technology, College of Semiconductors (College of Integrated Circuits), Hunan University, Changsha 410082, China
2
Changsha Semiconductor Technology and Application Innovation Research Institute, College of Semiconductors (College of Integrated Circuits), Hunan University, Changsha 410082, China
3
State Grid Hunan Electric Company Limited Disaster Prevention and Reduction Center, Changsha 410007, China
4
State Key Laboratory of Disaster Prevention and Reduction for Power Grid, Changsha 410007, China
* Corresponding authors (emails: This email address is being protected from spambots. You need JavaScript enabled to view it.
(Baohui Chen); This email address is being protected from spambots. You need JavaScript enabled to view it.
(Ming Zhang))
Received:
17
December
2025
Revised:
5
January
2026
Accepted:
15
January
2026
Abstract
The urgent demand for sustainable energy storage systems has driven extensive research on high-performance lithium-ion batteries (LIBs). However, graphite anodes have inherent drawbacks such as surface heterogeneity and limited rate performance. We developed an F/N co-doped carbon-coated graphite anode (G@FN) to tackle these challenges. Specifically, F-doping induces the formation of a highly ionically conductive LiF-rich SEI film. Furthermore, N-doping enhances the electrical conductivity of materials. This synergistic effect significantly enhances interfacial stability and lithium storage kinetics. The G@FN core-shell anode material exhibits a high specific capacity of 402.05 mAh g−1 and excellent cycling stability (maintaining a specific capacity of 113.19 mAh g−1 after 350 cycles at 2 C, with a capacity retention rate of 91.66%). This work demonstrates a simple and cost-effective artificial interfacial engineering strategy, providing methods for advancing high-rate and long-cycle-life graphite-based LIBs.
Key words: F/N co-doped / carbon coating / graphite anode / long cycle life / lithium-ion batteries
© The Author(s) 2026. Published by Science Press and EDP Sciences.
 This is an Open Access article distributed under the terms of the Creative Commons Attribution License (https://creativecommons.org/licenses/by/4.0), which permits unrestricted use, distribution, and reproduction in any medium, provided the original work is properly cited.
INTRODUCTION
With the continuous development of the global economy, as well as the explosive growth in energy demand, green energy storage technologies have garnered significant attention [1–3]. Lithium-ion batteries (LIBs) show great promise for green energy storage because of their performance stability, slow capacity fade, and low cost [4,5]. The graphite anode is the dominant material in LIBs. However, the practical application of graphite anodes is still limited by two main factors. On one hand, the inherent surface heterogeneity in graphite leads to the formation of a non-uniform and unstable solid electrolyte interphase (SEI) film, thereby compromising cycling stability [6]. On the other hand, the C–C bonds in the graphite basal plane are highly stable. As a result, Li+ tends to intercalate into graphite primarily from the edge sites, which increases the diffusion distance and consequently reduces the electrical conductivity of the material [7]. These phenomena adversely affect the electrochemical performance and safety of the battery.
Elemental doping is a mature and effective modification technique for improving the overall properties of materials [8,9]. For instance, Su et al. [10] employed sodium citrate as a carbon source and urea as a nitrogen source, obtaining a carbon-coated graphene anode material after high-temperature calcination. In another study, Kang et al. [11] used polytetrafluoroethylene as a fluorinating agent and achieved F doping of graphite through a high-temperature melting method. Polyvinylidene fluoride (PVDF) is chosen as the precursor because its molecular chains are rich in F atoms. Its unique C–F bonds provide the material with excellent chemical stability [12]. Melamine (MA), as a nitrogen-rich precursor, can form a nitrogen-doped carbon framework with a three-dimensional cross-linked structure during pyrolysis [13]. Studies have shown that through the heat treatment process, PVDF and melamine form coating layers doped with F and N elements, respectively. While N-doped graphite anodes lack sufficient inorganic components in the SEI layer, F-doped graphite anodes are prone to forming an insulating SEI film.
In this work, an optimization strategy for graphite anodes based on the synergistic modification of PVDF and MA is proposed. The G@FN material was successfully prepared via ball-milling followed by a segmented high-temperature carbonization process, ultimately constructing a stable F/N co-doped carbon-coated structure. Specifically, F-doping promotes the formation of a stable LiF-rich SEI film on the graphite surface, which enhances the structural and electrochemical stability of the graphite. N-doping offers additional Li+ adsorption/desorption sites to enhance the electrical conductivity of materials. The results demonstrate that the G@FN anode exhibits a porous structure, high specific capacity, and excellent cycling stability. This study provides a new perspective for the design and preparation of high-performance graphite anodes.
RESULTS AND DISCUSSION
The coin-cells were assembled in a similar manner to our previous study [14,15]. The G@FN was synthesized via ball-milling followed by a segmented high-temperature carbonization process (Figure S1). In Figure 1a, graphite (G) exhibits an irregular, lumpy granular morphology. At the lateral edges of G, the characteristic layered stacking structure of graphene is clearly observable. In contrast, the surfaces of G@F (Figure S2a) and G@FN (Figure 1d) exhibit a certain degree of gloss and smoothness, with scattered carbon flakes distributed across the carbon layer. This indicates successful encapsulation of the graphite surface carbon layer. Compared to G@F, the G@FN surface features a denser F/N co-doped carbon encapsulation layer and a greater number of carbon flakes (Figure S2b). G exhibits a highly ordered layered stacking morphology with lattice fringes of 0.336 nm, corresponding to the graphite (002) crystal plane (Figure 1b). In contrast, the surface of G@FN clearly reveals a layer of pyrolytic carbon approximately 15 nm thick, displaying amorphous carbon characteristics (Figure 1c). The continuous and uniform carbon coating layer effectively buffers the volume expansion of graphite particles during cycling. This result further demonstrates the successful encapsulation of F/N co-doped carbon. Energy dispersive X-ray spectroscopy (EDS) analysis confirmed the presence of four elements (C, O, N, and F) in the G@FN material, with detectable concentrations of F and N (Figure S2d). Concurrently, a relatively uniform layer of carbon was observed on the graphite surface (Figure 1e), where the distribution of F and N elements largely coincided with that of C and O, exhibiting a uniform and continuous state (Figure S2c). This indicates that during the coating and thermal treatment processes, the F and N elements contained in PVDF and MA, respectively, were effectively retained and uniformly distributed across the graphite surface. Partially intercalated between graphite layers, they successfully formed C–F and C–N bonds, facilitating the construction of an efficient carbon network structure that enhances electron and ion conduction.
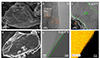 |
Figure 1 (a, d) Scanning electron microscopy (SEM) images of G and G@FN; (b, c) transmission electron microscopy (TEM) images of G and G@FN; (e) energy dispersive X-ray spectroscopy (EDS) elemental mapping of G@FN. |
In Figure 2a, the Raman images of G, G@F, and G@FN all exhibit D peak and G peak [16]. Furthermore, the ratio of D peak intensity to G peak intensity (ID/IG) serves as a measure of the graphitisation degree of carbon materials [17]. The conversion of PVDF and MA into amorphous carbon with low graphitic order during carbonisation, coupled with the introduction of additional defects through F and N element doping, increases the material’s D peak intensity and ID/IG value [18]. Meanwhile, X-ray diffraction (XRD) results show a decrease in diffraction peak intensity and an increase in the full width at half maximum (FWHM) for G@FN, indicating that doping disrupts the long-range ordered arrangement of graphite and introduces greater lattice distortion, which collectively contribute to the increased ratio. Therefore, the calculation shows that the ID/IG of G@FN is 0.583, which is higher than that of G (0.167). The crystal structures of G, G@F, and G@FN were characterised using XRD (Figure 2b). The diffraction peaks for G, G@F, and G@FN were essentially consistent with those observed in graphite (PDF#98-000-0231), indicating that the encapsulation modification did not alter the inherent crystal structure of the materials [19]. Concurrently, a prominent characteristic diffraction peak was observed at approximately 26.5°, corresponding to the graphite (002) plane [20]. As the surface coating layers of G@F and G@FN comprise amorphous carbon layers, the reduced structural order of these materials led to diminished intensity of the graphite (002) diffraction peak [21]. The interlayer spacing and graphitisation degree for G, G@F, and G@FN were determined using the Mering-Maire formula (Equation S1). The interlayer spacing increased across the samples and the graphitization degree decreased accordingly (Table S1). Notably, the diffraction peak in G@F and G@FN exhibits a pronounced low-angle shift, indicating an increased interlayer spacing of the graphite (002) plane (Figure S3a). On the one hand, F atom doping is substitutional doping, and its main effect is to modify the electronic structure and in-plane bond length of the carbon sheets. Since the substituting atoms primarily reside within the carbon layers, their contribution to increasing the interlayer spacing is negligible [22,23]. On the other hand, N atom doping introduces additional defects that disrupt the originally ordered arrangement of graphite crystals, reducing their crystalline order [24,25]. The full spectrum of G@FN reveals signals for four elements: C, N, O, and F (Figure 2c), confirming the presence of F/N co-doped carbon (Table S2). The C 1s spectra of G, G@F, and G@FN are shown in Figure S3b, c and Figure 2d. The C 1s spectrum of G@FN shows six characteristic peaks (Figure 2d) [11]. The formation of the C–N bond is due to nitrogen atoms generated from the decomposition of MA, which diffuse onto the graphite surface or into the interior, reacting with carbon atoms to form C–N bonds [26]. In Figure 2e and Figure S3d, the covalent C–F bond originates from the typical covalent C–F bond in the PVDF structure, while the conductive semi-ionic C–F bond results from the interaction between fluorine atoms and carbon atoms in graphite [27–29]. Furthermore, the N 1s spectrum of G@FN reveals five characteristic peaks (Figure 2f). Their contents are in Table S3. The N 1s spectrum of G@FN can be deconvoluted into five characteristic peaks, corresponding to pyridinic N, pyrrolic N, graphitic N, oxidized N, and fluorinated N. It is generally accepted that pyridinic and pyrrolic nitrogen generate more vacancy defects and edge active sites, which are crucial for the rapid storage of lithium ions. The above results indicate that a layer of F/N co-doped carbon has been successfully constructed on the graphite surface.
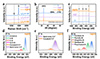 |
Figure 2 (a) Raman spectra of G, G@F, and G@FN; (b) X-ray diffraction (XRD) patterns of G, G@F, and G@FN; (c) X-ray photoelectron spectroscopy (XPS) survey spectra; (d) C 1s spectrum of G@FN; (e) F 1s spectrum of G@FN; (f) N 1s spectrum of G@FN. |
It was observed from Figure S4a that for G, the adsorption amount increases slowly at low relative pressure, and only shows a significant rise in adsorption at higher relative pressures. For G@F and G@FN, at P/P0 around 0.4–0.9, the adsorption isotherm and desorption isotherm do not overlap due to the non-fully reversible interaction between N2 and the graphite pore structure. This indicates that the F and N element doping processes introduce more defects, making the mesoporous structure in the modified graphite dominant. Figure S4b–d show that the pore size of G@F and G@FN is mainly concentrated around 3.8 nm, indicating the formation of small mesopores in the modified graphite. The relevant data calculated are shown in Table S4. Therefore, G@FN exhibits unique porous structural characteristics, with a high specific surface area and pore volume, and a lower average pore diameter. This structure contains abundant diffusion pathways and active sites, effectively improving the reaction kinetics.
The CV curves of the G, G@F, and G@FN anodes at a scan rate of 0.1 mV s−1 are shown in Figure S5a–c. The underpotential deposition (UPD) is present on the uncoated anode, whereas no significant signs of UPD are observed on the doped anode. In the doped anode, the amorphous structure of the carbon layer and defect sites provides rapid pathways for lithium ions to enter the bulk, reducing local Li+ accumulation on the surface and disrupting the specific adsorption patterns of lithium associated with the long-range ordered graphite lattice, thereby suppressing pronounced UPD. During the scan, the reduction and oxidation peaks of the G, G@F, and G@FN anodes were almost at the same positions. In the first cycle, the G@F and G@FN anodes exhibited a C–F reduction peak near 1.5 V [30]. In the CV curves, three anode materials exhibit plateaus or broad peaks at approximately 0.3 V. The broadening of the peaks is attributed to the fact that doping alters the local interlayer spacing and disrupts the originally uniform potential energy surface, leading to inhomogeneous embedding sites for lithium ions. The carbon coating layer introduced additional active sites and more defects on the graphite surface, which improved the interfacial charge transfer rate. In contrast, the G@FN anode showed the most distinct redox peaks and the highest peak current, demonstrating highly reversible Li+ deintercalation/intercalation electrochemical behavior [31]. The first-cycle charge/discharge curves of the G, G@F, and G@FN anodes at 0.1 C (Figure 3a). The results indicate that the initial charge/discharge capacities of the G anode are 356.86 and 399.78 mAh g−1, with an initial coulombic efficiency (ICE) of 89.26%. The results indicate that the initial charge/discharge capacities of the G@F anode are 384.29 and 413.33 mAh g−1, with a high ICE of 92.97%. In contrast, the G@FN anode shows a significant increase in initial capacity (charge and discharge capacities of 402.05 and 451.62 mAh g−1, respectively), with an ICE of 89.02%. The PVDF and MA synergistic effect leads to the formation of more mesoporous structures on the surface of G@FN and introduces more active sites, effectively increasing the lithium storage capacity of graphite. However, the increase in specific surface area leads to greater consumption of active lithium during SEI formation, which in turn results in a reduced ICE [32]. Although these features increase the contact area with the electrolyte, they significantly enhance the rate capability and cycling stability of the material. Additionally, the charge/discharge curves of the G@FN anode during the first three cycles at 0.1 C show that a stable SEI film is formed during the first cycle, and the subsequent charge/discharge curves almost overlap, demonstrating excellent electrochemical reversibility and interfacial stability (Figure S5e). At current rates of 0.2, 0.5, 1, 2, 3, and 5 C, the specific capacities of the G@FN anode are 347.02, 292.79, 227.95, 148.33, 85.16, and 44.02 mAh g−1, respectively (Figure 3b). The F/N co-doped carbon coating provides some active sites for lithium storage, improving the specific capacity at different current rates. When the current rate is suddenly returned to 0.2 C, the reversible capacity of the G@FN anode rapidly recovers to 341.59 mAh g−1 and remains stable over 50 cycles, maintaining a capacity of 339.19 mAh g−1 with a capacity retention rate of 99.29%. During the rate test, the G anode shows noticeable capacity fading and fluctuation in performance curves. In contrast, the G@FN anode, with its LiF-rich stable SEI film, can quickly and stably intercalate and de-intercalate Li+ during charge/discharge from low to high rates, exhibiting a relatively steady rate performance curve [33,34]. The cycling performance of the G, G@F, and G@FN anodes at 0.5 C is shown in Figure S5d. After 150 cycles, the G anode rapidly decreased from an initial capacity of 267.63 to 249.93 mAh g−1, with a capacity retention of only 93.38%, which may be attributed to the instability of the layered stacking structure of G. In contrast, the charge capacity of G@F decreased from the initial 283.25 to 271.13 mAh g−1, with a capacity retention of 95.72%. The G@F anode had a relatively stable coating layer on its surface, which enhanced both capacity and cycling stability. The charge capacity of G@FN decreased from an initial 310.98 to 301.43 mAh g−1, with a capacity retention of 96.92%. When N elements were also introduced, they effectively increased the active sites, further improving the lithium storage capacity of graphite. Therefore, under low current conditions, G@FN exhibited higher specific capacity and better cycling stability. Furthermore, the cycling performance of the G, G@F, and G@FN anodes at 2 C is shown in Figure 3c. After 350 cycles, the charge capacity of the graphite anode decreased from the initial 95.01 to 61.21 mAh g−1, with a capacity retention of only 64.42%. In contrast, the G@FN anode exhibits excellent cycling stability, with the specific capacity slightly decreasing from the initial 123.48 to 113.19 mAh g−1, and a capacity retention of 91.66%. The synergistic modification of the original graphite with PVDF and MA results in stable C–F and C–N bonds, which help the coating layer tightly adhere to the graphite surface. This not only protects the structural integrity of the graphite, allowing it to effectively buffer the volume effect of the graphite particles during high-rate cycling, but also enhances the electrical conductivity of the materials. Therefore, the G@FN anode in this study demonstrates excellent cycling stability.
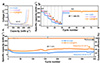 |
Figure 3 (a) Galvanostatic charge/discharge curves of G, G@F, and G@FN anodes at 0.1 C; (b) rate performance; (c) cycling performance at 2 C. |
The galvanostatic intermittent titration technique (GITT) testing is shown in Figure 4a, c and Figure S6a, b. The G anode exhibits significant fluctuations in the voltage curve due to interfacial charge transfer hysteresis and the Li+ concentration gradient, with a noticeable voltage drop in the later stages, displaying a large charge/discharge voltage hysteresis [35]. In contrast, the G@FN anode demonstrates better voltage platform stability. The F/N co-doping introduces more defects and functional groups on the graphite surface, promotes the formation of a stable LiF-rich SEI film, and constructs an efficient conductive network. Moreover, from Equation S2, it was calculated that the DLi+ (lithium-ion diffusion coefficient) of the G@FN anode is one order of magnitude higher than that of the G anode, indicating its excellent diffusion kinetics (Figure 4b). Direct electrochemical impedance spectroscopy (EIS) testing of the battery after resting revealed that the resistance of G@FN is much lower than that of G (Figure S6c). After three activation cycles, both G and G@FN showed a decrease in resistance, which is attributed to the formation of the SEI film on the graphite surface during the first activation cycle, significantly reducing the interfacial resistance (Figure S6d). After 100 cycles, the Rct of G increased from 151.80 to 340.50 Ω, and the Rct of G@FN showed a significantly smaller change, rising from 29.08 to 77.30 Ω (Figure S6e). This indicates that the carbon layer and the F/N co-doping promote the formation of a stable LiF-rich SEI film on the graphite surface and significantly improve the rates of Li+ diffusion and electron transfer [36]. Based on Equation S3, the Li+ diffusion coefficient at the electrode interface was calculated using EIS. The results show that the σ slope value of the G anode (379.11) is approximately 2.5 times that of the G@FN anode (150.88), and the DLi+ values for G and G@FN are 1.93×10⁻¹³ and 1.21×10⁻¹², respectively (Figure 4d). The increase in DLi+ indicates that G@FN has more active sites for Li+ intercalation, which effectively facilitates Li+ diffusion on and within the graphite surface. The exchange current densities (j0) of the G and G@FN anodes were calculated using Equation S4. The j0 value of the G@FN anode is 0.78, higher than that of the G anode (0.14 mA cm−2), indicating superior reaction kinetics (Figure 4e). This is because the pyrolyzed carbon containing F and N elements introduces a large number of active sites on the graphite surface, providing additional sites for Li+ de-intercalation and thereby facilitating rapid Li+ diffusion while enhancing the lithiation process.
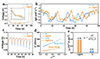 |
Figure 4 (a, c) Galvanostatic intermittent titration technique (GITT) curves and localised magnification comparisons; (b) ion diffusion rate; (d) ion diffusion rate calculated from electrochemical impedance spectroscopy (EIS); (e) exchange current density. |
After 100 cycles, the surface of the G anode exhibits significant dead lithium (moss-like structure) and some black pits (cavities caused by uneven lithium deposition and the detachment of dead lithium), indicating poor structural integrity (Figure 5a). This phenomenon may be related to the instability of the G structure at high rates. In contrast, the scanning electron microscopy (SEM) image of the G@FN anode after 100 cycles (Figure 5d) shows a relatively smooth and dense surface, with no visible dead lithium or black pits, demonstrating a more stable and compact structural morphology. This indicates that F/N co-doping and carbon coating effectively prevent solvent co-intercalation phenomena and promote the formation of a stable LiF-rich SEI film, suppressing side reactions and structural damage [37,38]. This tight adhesion not only protects the structural integrity of the graphite but also effectively buffers the volume expansion during cycling, preventing the rupture of the coating layer caused by volume changes and maintaining the long-term suppression of solvent co-intercalation. Comparing the G electrode before and after 100 cycles, the intensity of the graphite (002) diffraction peak decreased, and a slight shift to a lower angle was observed (Figure 5b). In contrast, for the G@FN electrode, although the intensity of the graphite (002) diffraction peak decreased after 100 cycles, there was no significant shift in the diffraction peak (Figure 5e). The interlayer spacing d002 and degree of graphitization (G) of the graphite crystal structure were calculated based on Equation S1, and the results are shown in Table S5. During cycling, the repeated intercalation and de-intercalation of Li+ between the graphite layers lead to the breaking and reorganization of chemical bonds within the graphite, causing the interlayer spacing to increase and the structure to become more loosened. In contrast, the physical barrier provided by the coating layer, along with the chemical stability of F and N-doped atoms and the strong polar bond interactions, effectively maintained the stability of the graphite structure. After 100 cycles, the graphite (002) diffraction peak of G@FN did not shift, and both the interlayer spacing and graphitization degree remained stable. The introduction of microscopic structural defects resulted in a decrease in the intensity of the graphite (002) diffraction peak. Comparing the G anode before and after 100 cycles, the ID/IG ratio increased to 0.439, much higher than the initial value of 0.167 (Figure 5c). In contrast, for the G@FN anode after 100 cycles, the ID/IG ratio increased from 0.583 to 0.641 (Figure 5f). The positions and full-width at half-maximum (FWHM) of the D and G peaks for both G and G@FN before and after cycling are shown in Table S6. In contrast, the increase in ID/IG and the FWHM of the G peak for G@FN was relatively small, and the FWHM of the D peak decreased. The unmodified G anode suffers from an unstable and non-uniform SEI film, which reduces the stability of performance. F/N co-doping promotes the formation of a stable LiF-rich SEI film while improving the electrical conductivity of the material and reducing the formation of structural defects during cycling. Therefore, the G@FN anode maintains a very stable structural state even after cycling, demonstrating excellent structural stability.
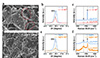 |
Figure 5 (a, d) SEM images after 100 cycles of G and G@FN; (b, e) XRD patterns of G and G@FN before and after 100 cycles; (c, f) Raman spectra of G and G@FN before and after 100 cycles. |
The total X-ray photoelectron spectroscopy (XPS) spectra of G and G@FN after cycling are shown in Figure S7a. The G@FN anode material detected C, O, N, P, F, and Li elements, with a noticeable presence of N signals compared to the G anode. The high-resolution F 1s spectrum revealed two peaks, corresponding to LiF and LixPOyFz, both reduction products of LiPF6 (Figure S7b, c). Further observation showed that the inorganic component LiF in the SEI film of the G@FN anode accounted for 76.74%, significantly higher than that of the G anode (39.75%). Additionally, the high-resolution Li 1s spectrum also showed that the proportion of LiF in the SEI layer of G@FN was higher than in the G anode (Figure S7d, e). It is noteworthy that inorganic components like LiF in the SEI film can effectively enhance the storage kinetics of Li+ at the interface, improving the mechanical strength of the SEI film. In Figure S7f, g, the presence of the C–F bond proves that the pyrolyzed carbon from PVDF remains relatively stable during cycling, without significant decomposition or detachment. In the O 1s spectrum (Figure S7h, i), the decomposition products of carbonate solvents on the surface of the G@FN anode, O–C=O and C=O/C–O–C (531.52 eV), accounted for 5.56% and 83.67%, respectively, which are lower than those in the G anode (O–C=O and C=O/C–O–C contents were 10.43% and 88.19%, respectively). Meanwhile, the Li2CO3 (55.37 eV) content of the G@FN anode is 64.98%, higher than that of the G anode (57.42%) (Figure S7d, e). The above XPS results indicate that the surface of the G@FN anode promotes the formation of a stable SEI film rich in inorganic components like LiF. This not only suppresses the reduction and decomposition of carbonate solvents in the electrolyte but also facilitates the formation and accumulation of Li2CO3, which has ionic conductivity, thereby improving the cycling performance and stability of the battery [39,40].
CONCLUSIONS
This study develops a modification strategy for graphite anodes in lithium-ion batteries. Specifically, the G@FN anode was successfully prepared by coating graphite with a pyrolyzed carbon layer containing F and N elements using a combination of PVDF and MA, followed by high-temperature treatment. Various characterization techniques, including SEM, transmission electron microscopy (TEM), XRD, Raman, and XPS, confirmed the successful formation of carbon coating. The results show that the G@FN anode material exhibited a significant increase in initial specific capacity, with charge and discharge capacities of 402.05 and 451.62 mAh g−1, respectively. This offers an economical and effective strategy for high-performance graphite-based lithium-ion batteries.
MATERIALS AND METHODS
Detailed materials and methods are provided in the Supplementary Information online.
Data availability
The original data are available from corresponding authors upon reasonable request.
Funding
This work was supported by the Science and Technology Projects of the State Grid Corporation of China (5500-202323102A-1-1-ZN).
Author contributions
Y.W. conducted data curation, performed the investigation, developed the methodology, wrote the original draft, and revised and edited the manuscript. Y.L. provided supervision for the research work. H.W. provided supervision for the study. B.C. acquired funding, administered the project, provided resources, and supervised the research. Y.C. administered the project and supervised the work. M.Z. acquired funding, administered the project, provided resources, and supervised the research.
Conflict of interest
The authors declare no conflict of interest.
Supplementary information
Supplementary file provided by the authors. Access Supplementary Material
The supporting information is available online at https://doi.org/10.1360/nso/20250083. The supporting materials are published as submitted, without typesetting or editing. The responsibility for scientific accuracy and content remains entirely with the authors.
References
- Huang Y, Wang C, Lv H, et al. Bifunctional interphase promotes Li+ de-solvation and transportation enabling fast-charging graphite anode at low temperature. Adv Mater 2023; 36: 2308675. [Article] [Google Scholar]
- Niu M, Dong L, Yue J, et al. A fast-charge graphite anode with a Li-ion-conductive, electron/solvent-repelling interface. Angew Chem Int Ed 2024; 63: e202318663. [Article] [Google Scholar]
- Zhang Q, Cui C, Chen H, et al. Surface cobaltization for boosted kinetics and excellent stability of nickel-rich layered cathodes. Natl Sci Open 2024; 3: 20240010. [Article] [Google Scholar]
- Xu T, Feng H, Liu W, et al. Opportunities and challenges of high-entropy materials in lithium-ion batteries. Rare Met 2024; 43: 4884-4902. [Article] [Google Scholar]
- Chen Y, Liu Y, He Z, et al. Artificial intelligence for the understanding of electrolyte chemistry and electrode interface in lithium battery. Natl Sci Open 2023; : 20230039. [Article] [Google Scholar]
- Zhang SS, Ma L, Allen JL, et al. Stabilizing capacity retention of Li-ion battery in fast-charge by reducing particle size of graphite. J Electrochem Soc 2021; 168: 040519. [Article] [Google Scholar]
- Zou Y, Wang Y. Microwave-assisted synthesis of porous nickel oxide nanostructures as anode materials for lithium-ion batteries. Rare Met 2011; 30: 59-62. [Article] [Google Scholar]
- Tang C, Qiu Z, Li C, et al. Rational synthesis of vertical graphene supported TiN@N-Li4Ti5O12 as advanced high-rate electrodes for lithium-ion batteries. Chin Chem Lett 2025; 36: 110589. [Article] [Google Scholar]
- Liang J, Qin Z, Quan Z, et al. A review of strategies to produce a fast-charging graphite anode in lithium-ion batteries. New Carbon Mater 2025; 40: 738-764. [Article] [Google Scholar]
- Su L, Gao L, Hou L, et al. Nitrogen-doped porous carbon coated on graphene sheets as anode materials for Li-ion batteries. Ionics 2018; 25: 1541-1549. [Article] [Google Scholar]
- Kang SX, Lun H, Qi YX, et al. Boosted electrochemical performance of graphite anode enabled by polytetrafluoroethylene-derived F-doping. Mater Chem Phys 2021; 261: 124214. [Article] [Google Scholar]
- Wang T, Tu S, Chen Y, et al. Scalable and flexible porous hybrid film as a thermal insulating subambient radiative cooler for energy-saving buildings. Natl Sci Open 2023; 2: 20220063. [Article] [Google Scholar]
- Feng S, Yu Q, Ma X, et al. Hydroformylation over polyoxometalates supported single-atom Rh catalysts. Natl Sci Open 2023; 2: 20220064. [Article] [Google Scholar]
- Wang JY, Lyu Y, Wei HX, et al. Constructing a simple conductive-elastic layer on graphite surfaces for high-rate and long-life lithium-ion batteries. Front Phys 2025; 20: 044207 [Google Scholar]
- Zou Y, Lyu Y, Wei H, et al. A green route based on π-π interactions to coat graphite for high-rate and long-life anodes in lithium-ion batteries. Mater Rep-Energy 2025; 5: 100332. [Article] [Google Scholar]
- Kaniyoor A, Ramaprabhu S. A Raman spectroscopic investigation of graphite oxide derived graphene. AIP Adv 2012; 2: 032183. [Article] [Google Scholar]
- Jiao X, Qiu Y, Zhang L, et al. Comparison of the characteristic properties of reduced graphene oxides synthesized from natural graphites with different graphitization degrees. RSC Adv 2017; 7: 52337-52344. [Article] [Google Scholar]
- Xiao P, Wang Z, Long K, et al. Stable cycling and low-temperature operation utilizing amorphous carbon-coated graphite anodes for lithium-ion batteries. RSC Adv 2024; 14: 13277-13285. [Article] [Google Scholar]
- Bayındır O, Sohel IH, Erol M, et al. Controlling the crystallographic orientation of graphite electrodes for fast-charging Li-ion batteries. ACS Appl Mater Interfaces 2022; 14: 891-899. [Article] [Google Scholar]
- Yan Y, Zhao X, Dou H, et al. Rational design of robust nano-Si/graphite nanocomposites anodes with strong interfacial adhesion for high-performance lithium-ion batteries. Chin Chem Lett 2021; 32: 910-913. [Article] [Google Scholar]
- Ye S, Han S, Tian F, et al. Dynamic ion-buffering gradient bilayer anode realizes 200 Wh kg−1 dendrite-free sodium battery. Natl Sci Rev 2025; 12: nwaf427. [Article] [Google Scholar]
- Wang P, Qiao B, Du Y, et al. Fluorine-doped carbon particles derived from lotus petioles as high-performance anode materials for sodium-ion batteries. J Phys Chem C 2015; 119: 21336-21344. [Article] [Google Scholar]
- Luo Z, Ma J, Wang X, et al. Surface engineering of fluorinated graphene nanosheets enables ultrafast lithium/sodium/potassium primary batteries. Adv Mater 2023; 35: 2303444. [Article] [Google Scholar]
- Fan X, Chen L, Ji X, et al. Highly fluorinated interphases enable high-voltage Li-metal batteries. Chem 2018; 4: 174-185. [Article] [Google Scholar]
- Groult H, Nakajima T, Perrigaud L, et al. Surface-fluorinated graphite anode materials for Li-ion batteries. J Fluorine Chem 2005; 126: 1111-1116. [Article] [Google Scholar]
- Zhao Y, Yang L, Ma C, et al. One-step fabrication of fluorine-doped graphite derived from a low-grade microcrystalline graphite ore for potassium-ion batteries. Energy Fuels 2020; 34: 8993-9001. [Article] [Google Scholar]
- Yang L, Zhao Y, Cao L, et al. Polyvinylidene fluoride-derived carbon-confined microcrystalline graphite with improved cycling life and rate performance for potassium ion batteries. Energy Fuels 2021; 35: 5308-5319. [Article] [Google Scholar]
- Wu Y, Feng X, Liu X, et al. In-built ultraconformal interphases enable high-safety practical lithium batteries. Energy Storage Mater 2021; 43: 248-257. [Article] [Google Scholar]
- Feng W, Long P, Feng Y, et al. Two-dimensional fluorinated graphene: Synthesis, structures, properties and applications. Adv Sci 2016; 3: 1500413. [Article] [Google Scholar]
- Liu Y, Yang S, Guo H, et al. Low LUMO energy carbon molecular interface to suppress electrolyte decomposition for fast charging natural graphite anode. Energy Storage Mater 2024; 73: 103806. [Article] [Google Scholar]
- Yeon SH, Jin CS, Shin KH, et al. Raising lithium-ion storage capacity by order-to-disorder transformation in MAX-derived carbon anode during cycling. Carbon 2021; 185: 681-696. [Article] [Google Scholar]
- Zhang D, Li L, Zhang W, et al. Research progress on electrolytes for fast-charging lithium-ion batteries. Chin Chem Lett 2023; 34: 107122. [Article] [Google Scholar]
- Chen J, Fan X, Li Q, et al. Electrolyte design for LiF-rich solid-electrolyte interfaces to enable high-performance microsized alloy anodes for batteries. Nat Energy 2020; 5: 386-397. [Article] [Google Scholar]
- Wang Z, He Z, Wang Z, et al. Engineering the solid electrolyte interphase for enhancing high-rate cycling and temperature adaptability of lithium-ion batteries. Chem Sci 2025; 16: 3571-3579. [Article] [Google Scholar]
- Zhang Z, Wang J, Zhang S, et al. Stable all-solid-state lithium metal batteries with Li3N-LiF-enriched interface induced by lithium nitrate addition. Energy Storage Mater 2021; 43: 229-237. [Article] [Google Scholar]
- Youn JW, Park GH, Kim M, et al. Surface modification with F-doped carbon layer coating on natural graphite anode for improving interface compatibility and electrochemical performance of lithium-ion capacitors. ACS Appl Electron Mater 2023; 5: 4344-4353. [Article] [Google Scholar]
- Sun G, Zhu B, He R, et al. Synergy of F− doping and fluorocarbon coating on elevating high-voltage cycling stability of NCM811 for lithium-ion batteries. Rare Met 2024; 44: 1577-1593. [Article] [Google Scholar]
- Liu C, Reed S, Manthiram A. Delineating the triphasic side reaction products in high‐energy density lithium‐ion batteries. Adv Mater 2025; 37: e09889. [Article] [Google Scholar]
- Zhao ZX, Bai X, Zhu HL, et al. Promoting the normal- and low-temperature performances of natural graphite by the F-doping derived from PVDF modification. ACS Appl Electron Mater 2022; 4: 4936-4946. [Article] [Google Scholar]
- Hu A, Chen W, Du X, et al. An artificial hybrid interphase for an ultrahigh-rate and practical lithium metal anode. Energy Environ Sci 2021; 14: 4115-4124. [Article] [Google Scholar]
All Figures
|
Figure 1 (a, d) Scanning electron microscopy (SEM) images of G and G@FN; (b, c) transmission electron microscopy (TEM) images of G and G@FN; (e) energy dispersive X-ray spectroscopy (EDS) elemental mapping of G@FN. |
| In the text | |
|
Figure 2 (a) Raman spectra of G, G@F, and G@FN; (b) X-ray diffraction (XRD) patterns of G, G@F, and G@FN; (c) X-ray photoelectron spectroscopy (XPS) survey spectra; (d) C 1s spectrum of G@FN; (e) F 1s spectrum of G@FN; (f) N 1s spectrum of G@FN. |
| In the text | |
|
Figure 3 (a) Galvanostatic charge/discharge curves of G, G@F, and G@FN anodes at 0.1 C; (b) rate performance; (c) cycling performance at 2 C. |
| In the text | |
|
Figure 4 (a, c) Galvanostatic intermittent titration technique (GITT) curves and localised magnification comparisons; (b) ion diffusion rate; (d) ion diffusion rate calculated from electrochemical impedance spectroscopy (EIS); (e) exchange current density. |
| In the text | |
|
Figure 5 (a, d) SEM images after 100 cycles of G and G@FN; (b, e) XRD patterns of G and G@FN before and after 100 cycles; (c, f) Raman spectra of G and G@FN before and after 100 cycles. |
| In the text | |
Current usage metrics show cumulative count of Article Views (full-text article views including HTML views, PDF and ePub downloads, according to the available data) and Abstracts Views on Vision4Press platform.
Data correspond to usage on the plateform after 2015. The current usage metrics is available 48-96 hours after online publication and is updated daily on week days.
Initial download of the metrics may take a while.